Do asset classes consistently exhibit momentum over the same time frame as stocks? In his January 2006 investing policy entitled “Class OutPerformance (COP) Strategy”, Mal Williams describes a dynamic asset allocation strategy based on intermediate-term total return momentum of fund proxies (a complex calculation spanning the past 12 months, but not simply the 12-month return) for a wide range of asset classes. Implementation involves investing each month in the 10 to 15 best-performing funds out of a universe of 80 funds. In an October 2011 update of strategy tests, he selects the eight best-performing asset class proxies (heavily overweighting returns from the last three months) out of 51 possible as long as their performance is better than cash, in which case he allocates to the money market. He considers two implementation scenarios: (1) reallocate at the monthly open immediately after the fund ranking interval (for which there may be data availability issues); and, reallocate in the middle of the month after the ranking interval. Using monthly returns and semi-monthly prices for the 51 asset class proxy funds the period January 1991 through September 2011, along with contemporaneous money market yields, he finds that:
Because the COP strategy returns shown for 1991 are for the fourth quarter only, we start with 1992. During 1992 through (partial) 2011, the average annual gross return of the COP strategy implemented with a half-month delay after the ranking interval is 16.7%, compared to 8.7% for the total return of S&P 500 Index. Standard deviations of annual returns are 16.7% and 19.4%, respectively.
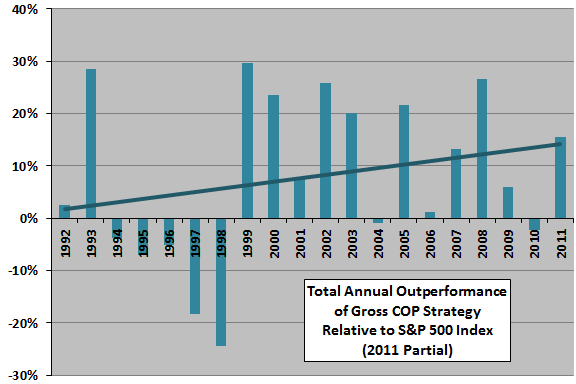
The following chart, constructed from the test results, depicts annual differences between the gross total return of the COP strategy implemented with a half-month delay after the ranking interval and the total return of the S&P 500 Index over the sample period, along with a linear best-fit trend line. Notable points are:
- COP outperforms the S&P 500 Index by an average 8.0% per year.
- COP beats the S&P 500 Index in 13 of 20 years (2011 partial).
- COP is relatively stronger in the latter part of the sample period (two bear markets) than the early part (including an extended bull market).
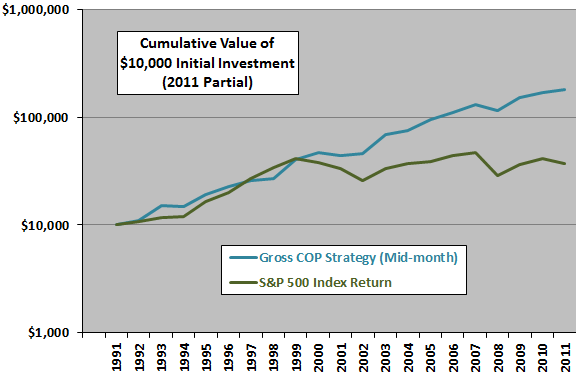
For another perspective, we look at cumulative results.

The next chart, also constructed from the test results, compares on a logarithmic scale the cumulative values of $10,000 initial investments at the beginning of 1992 through September 2011 in the gross COP strategy implemented with a half-month delay after the ranking interval and the S&P 500 Index (total return with dividends reinvested). Terminal values are $180,370 and $37,323, respectively. Results show that the COP strategy approximately tracks the S&P 500 Index during 1992-2000 and consistently outperforms thereafter.
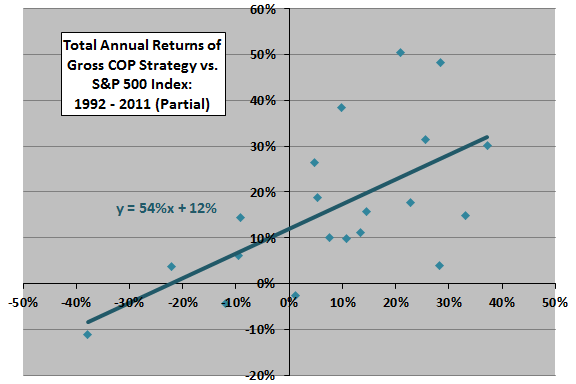
For a third perspective, we look at a scatter plot.

The final chart, also constructed from the test results, relates the annual gross return for the COP strategy implemented with a half-month delay after the ranking interval to same-year total return for S&P 500 Index over the sample period. The COP strategy has a beta relative to the S&P 500 Index of 0.54 and an annual alpha of 12%.

In summary, evidence indicates that asset classes exhibit intermediate-term momentum that may support a rotation strategy pursuing hot asset classes.
Cautions regarding findings include:
- Since the COP strategy encompasses many non-equity and global asset classes, some passive mix of asset classes may be a more appropriate benchmark than the S&P 500 Index.
- The sample period (about 20 years) is not long relative to the lagged return measurement interval (one year).
- Reported returns are gross, not net. Depending on turnover and account size, the approach of investing each month in the top eight or 15 asset class proxies may incur material trading frictions that reduce these returns.
- The complex calculation of fund momentum introduces discretionary parameters (weighting factors for returns over different parts of the past 12 months). Optimization of strategy performance relative to these parameters introduces data snooping bias, such that results likely incorporate luck and overstate reasonable expectations for future returns.
- The COP strategy likely generates many short-term capital gains.