Do any of the various U.S. stock market size and value/growth styles systematically lead or lag the overall market, perhaps because of some underlying business/economic cycle? To investigate, we consider the the following six exchange-traded funds (ETF) that cut across capitalization (large, medium and small) and value versus growth:
iShares Russell 1000 Value Index (IWD) – large capitalization value stocks.
iShares Russell 1000 Growth Index (IWF) – large capitalization growth stocks.
iShares Russell Midcap Value Index (IWS) – mid-capitalization value stocks.
iShares Russell Midcap Growth Index (IWP) – mid-capitalization growth stocks.
iShares Russell 2000 Value Index (IWN) – small capitalization value stocks.
iShares Russell 2000 Growth Index (IWO) – small capitalization growth stocks.
Using monthly dividend-adjusted closing prices for the style ETFs and S&P Depository Receipts (SPY) over the period August 2001 through December 2014 (161 months, limited by data for IWS/IWP), we find that:
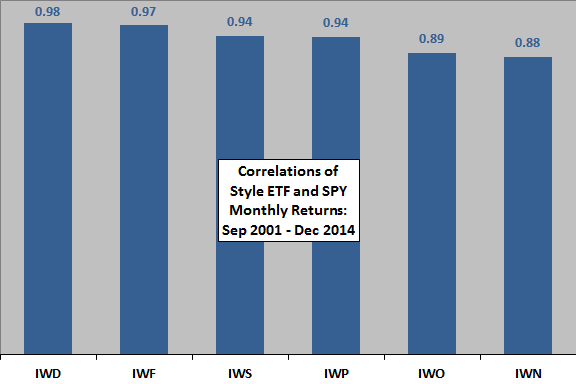
The following chart shows the correlations of coincident monthly returns for each of the six style ETFs with the monthly returns of SPY over the available sample period, displayed in order of decreasing correlation. All correlations are high, generally decreasing with size.
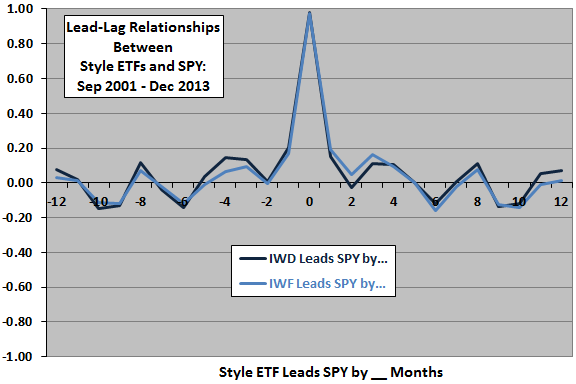
To test for lead-lag relationships, we calculate correlations for the monthly returns of each ETF offset by intervals ranging from -12 months (styles lag the market) to +12 months (styles lead the market) with respect to the monthly returns of SPY. If there is a systematic leading or lagging relationship between a style ETF and SPY of a year or less, it should emerge as a notably positive or negative correlation over this range of offsets.
The following chart shows the offset correlations for the large-capitalization style ETFs. The coincident correlations dominate, and correlations for other style-market lead-lag relationships appear to be at noise level but scalloped, perhaps due to synchronization of dividends.
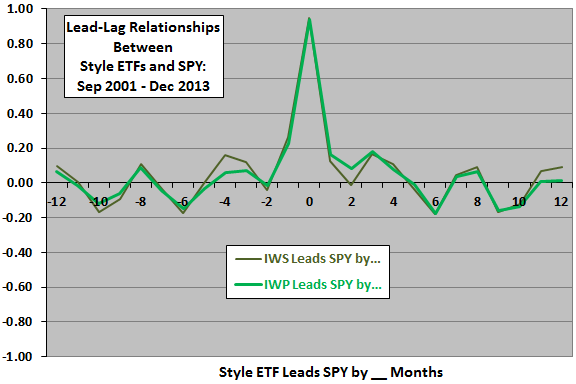
The following chart shows the offset correlations for the mid-capitalization style ETFs. The coincident correlations dominate, and correlations for other style-market lead-lag relationships appear to be at noise level but again scalloped.
The following chart shows the offset correlations for the small-capitalization style ETFs. The coincident correlations dominate, and correlations for other style-market lead-lag relationships appear to be at noise level but again scalloped.
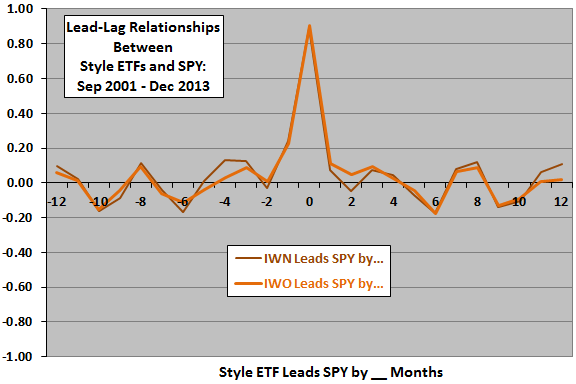
In summary, there is little evidence that equity size and value/growth ETFs usefully lead or lag the overall U.S. stock market over the short available sample period.
Cautions regarding findings include:
- The sample is extremely small in terms of the number of underlying business/economic cycles.
- Offsetting monthly returns modestly reduces sample size.
- The iShares style definitions may not be concentrated enough to exploit style peculiarities identified in some research.