Both “Stock Return Correlations and Retail Trader Herding” and “Stock Return Correlations and Equity Market Stress” imply that extremely high correlations among stock returns accompany severe market declines and may signal market bottoms. Is there some simple way to exploit this implication? Keying on the former item, we investigate the correlation of returns between a large-stock index (the S&P 500 Index) and a small-stock index (the Russell 2000 Index) as a trading signal. We hypothesize that, when this correlation is very low (high), equity markets are near a top (bottom). Using weekly returns for the S&P 500 Index since September 1987, the Russell 2000 Index since inception in September 1987, SPDR S&P 500 (SPY) since inception in January 1993 and ProShares Short S&P 500 (SH) since inception in June 2006, along with the weekly yield on 13-week Treasury bills (T-bill) as the return on cash, all through November 2013, we find that:
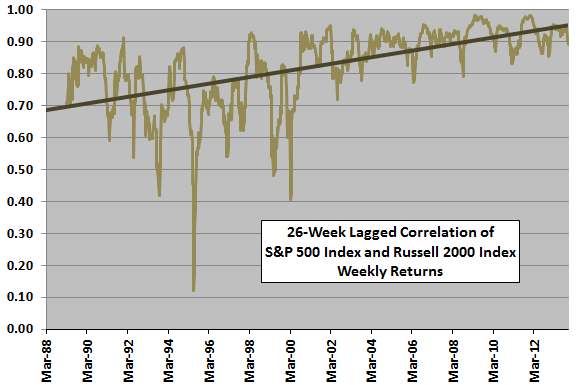
We elect to calculate index return correlations over lagged rolling windows of 26 weeks, intuitively long enough for sampling and short enough to respond to changing market conditions.
The following chart plots this rolling correlation since March 1988 (limited by inception of the Russell 2000 Index). Results exhibit considerable variability and an upward trend over the sample period, indicating that specifying low and high correlations requires an adaptive (rolling window) threshold. We elect a threshold based on: (1) a rolling window of 52 weeks of correlations; and, (2) a set number of standard deviations relative to the average correlation for each window.
Under the hypothesis that a relatively low (high) correlation signals a market top (bottom), trading strategy rules are as follows:
- Go long SPY whenever the current lagged correlation of index returns is more than 0.5 standard deviation below its lagged 52-week average. Go to cash (SPY-Cash) or short SPY (SPY Long-Short) whenever the correlation falls below this threshold. Assume feasibility of estimating the signal just before the weekly close, allowing execution at that same close.
- The return on cash is the contemporaneous T-bill yield.
- One-way trading friction is 0.1% of the portfolio balance.
- Ignore costs of shorting SPY and tax implications of trading.
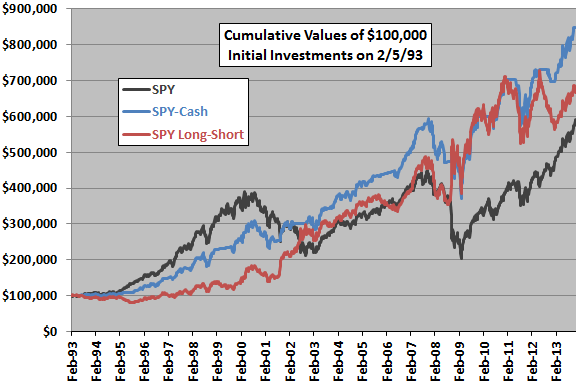
The next chart compares the cumulative values of $100,000 initial investments at the close on 2/5/93 for buying and holding SPY (SPY) and for the SPY-Cash and SPY Long-Short active alternatives. The active strategies are long SPY 68% of the time, with 76 switches over the sample period. Trading friction for SPY Long-Short is twice that of SPY-Cash since each switch include a buy and a sell.
Terminal values are $590,375, $848,805 and $667,516 for SPY, SPY-Cash and SPY Long-Short, respectively.
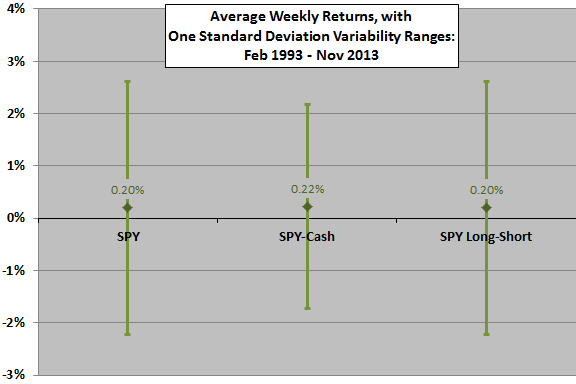
For another perspective, we compare weekly return statistics.
The next chart summarizes average weekly returns for SPY, SPY-Cash and SPY Long-Short, with one standard deviation variability ranges over the available sample period. Weekly return-to-risk ratios are 0.08, 0.11 and 0.08, respectively.
Overall, SPY-Cash is the superior strategy.
Might the ignored cost of shorting SPY be decisive for the performance of SPY Long-Short?
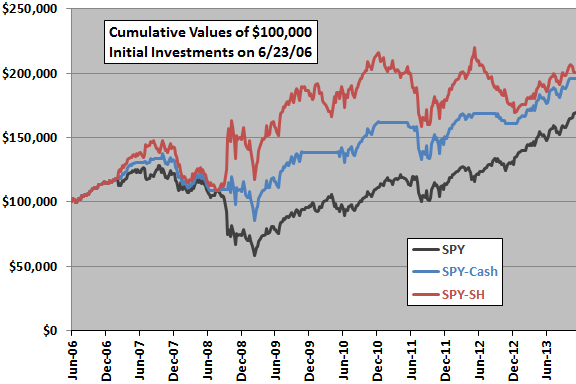
The next chart compares the cumulative values of $100,000 initial investments at the close on 6/23/06 for SPY, SPY-Cash and a long-short strategy alternative that buys SH rather than shorting SPY (SPY-SH). The active strategies are long SPY 70% of the time over this subperiod, with only six switches.
Terminal values are $169,223, $195,883 and $200,622 for SPY, SPY-Cash and SPY-SH, respectively. Weekly return-to-risk ratios are 0.06, 0.08 and 0.08, respectively.
Over this subperiod, SPY-SH is mostly the better strategy, largely due to performance during 2008.
How robust are results to variation in key parameters?
Key parameters and single-variable sensitivities based on terminal values in the final chart above (since June 2006) are:
26-week correlation measurement interval: In a sensitivity test of intervals of 13, 26, 39, 52, 65 and 78 weeks, 39 weeks is best and 65 weeks is worst. Both 39 weeks and 52 weeks are better than 26 weeks. Irregularities across the range of intervals undermine confidence in systematic dependence of outcome on interval length.
52-week correlation reference interval: In a sensitivity test of intervals of 13, 26, 39, 52, 65 and 78 weeks, 39 weeks is again best and 26 weeks is worst. Again, irregularities across the range of intervals undermine confidence in systematic dependence of outcome on interval length.
Above (below) 0.5 standard deviation below the average correlation over the reference interval as the threshold for for going long (to cash or short): In a sensitivity test of signal thresholds ranging from 0.0 to 1.5 standard deviations, 0.3 is best. For all values below (above) about 0.8 make the active strategies outperform (underperform) buying and holding SPY. Irregularities across the range 0.0-0.7 undermine confidence in systematic dependence of outcome on signal threshold.
0.1% one-way trading friction: SPY-Cash (SPY-SH) beats buying and holding SPY for one-way trading friction below about 0.6% (0.4%).
For example, terminal values for SPY-Cash and SPY-SH are $224,095 and $257,758 respectively, for a 39-week correlation measurement interval, a 39-week correlation reference interval and a 0.3 standard deviation signal threshold (compared to $195,883 and $200,622 for the baseline parameter set).
In summary, evidence mostly supports belief in the effectiveness of a trading strategy responding to changes in the intermediate-term past return correlation between small stocks and large stocks by going to cash or shorting when the correlation is relatively very low.
Cautions regarding findings include:
- As noted, sensitivity analyses suggest that luck (randomness) plays a role in outcomes.
- Use of daily or monthly rather than weekly returns may affect results.
- The sample period for the long-short strategy using SH is short in terms of broad market conditions. However, agreement with longer-term index behavior mitigates this caution.
- Increasing correlations across equity styles may disrupt the strategy.