What is the best approach for measuring the stock picking, industry concentration and factor risk aspects of active fund management? In the October 2007 update of their paper entitled “How Active Is Your Fund Manager? A New Measure That Predicts Performance”, Martijn Cremers and Antti Petajisto introduce “Active Share” to quantify active portfolio management in terms of the share of portfolio holdings that differ from the makeup of an appropriate benchmark index. They then apply Active Share (measuring stock/industry selection) in combination with index tracking error (measuring factor bets) to evaluate equity mutual funds. Using data on holdings and returns for 2,647 U.S. equity mutual funds and 19 associated benchmark indexes spanning 1980-2003, they conclude that:
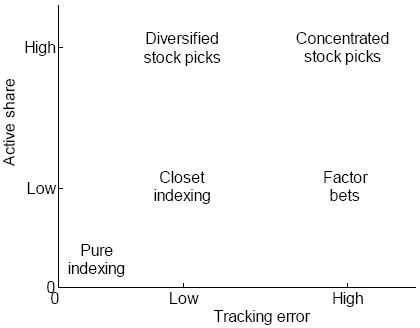
- While there is a positive correlation between Active Share and tracking error, these measures show considerable independence. For example, funds with 4-6% tracking errors can have Active Shares ranging from 30% to 100%, and funds with 70-80% Active Shares can have tracking errors ranging from 2% to over 14%. In other words, stock pickers can be very active despite low tracking errors, and systematic factor betters can generate large tracking errors without large deviations from index holdings. (See the first figure below.)
- Funds with the highest (lowest) Active Shares on average outperform (underperform) their benchmarks by a little over 1.1% (more than -1.4%) per year after expenses.
- Tracking error by itself is unrelated to fund returns. Funds that focus on systematic factor bets therefore tend to exhibit poor after-expense performance.
- High tracking error often arises from industry concentration, whereas diversified active stock picking supports low tracking error.
- A fund’s Active Share is extremely persistent over time. Small funds are generally more active than large funds.
- Excluding index funds, there is little relationship between expense ratio and Active Share, making funds with low Active Share that claim to be active (closet indexers) expensive.
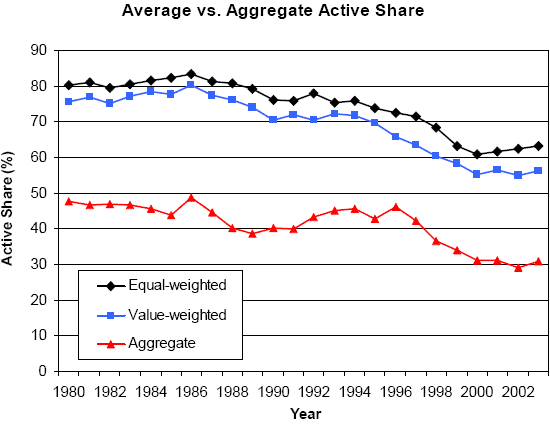
- Active Shares have generally trended downward over time. The percentage of assets under management with Active Share less than 60% (more than 80%) go from 1.5% (42.8%) in 1980 to 44.8% (23.3%) in 2003. (See the second figure below.)
- Active Share helps predict fund performance. Funds that have the highest 20% of Active Shares and the highest 20% of last-year returns continue to outperform their benchmarks by an average 5.1% per year after expenses (3.5% per year adjusted for size, book-to-market and momentum).
- More impressively, among funds below median size, those that have the highest 20% of Active Shares and the highest 20% of prior-year returns continue to outperform their benchmarks by an average 6.5% per year after expenses (4.8% per year adjusted for size, book-to-market and momentum).
The following chart, taken from the paper, summarizes fund management styles based on Active Share (stock/industry selection) and tracking error (systematic risk). A concentrated stock picker combines the two dimensions, taking positions in individual stocks and systematic risks.
A closet indexer claims to be active but scores low on both dimensions.

The next chart, also from the paper, summarizes the trend in Active Share among active mutual funds that use the S&P 500 index as a benchmark over the period 1980-2003. It shows trends for average Active Share: (1) equally weighted across funds; (2) weighted according to fund size; and, (3) calculated after aggregating all fund portfolios into a single portfolio. In general, the level of active management declined throughout the 1990s. The difference between the value-weighted average Active Share and the aggregate average Active Share represents the degree to which the funds trade against each other. This group of mutual funds currently offers investors a relatively low aggregate Active Share of about 30%, helping to explain why the average mutual fund underperforms the benchmark index after expenses.

In summary, fund investors should focus on funds with high “Active Shares” (holdings very different from their benchmark indexes), low assets under management and high last-year returns.