Can investors/traders outperform by exploiting (or avoiding) the black swans that populate daily equity market returns? In his November 2007 paper entitled “Black Swans and Market Timing: How Not To Generate Alpha”, Javier Estrada investigates the influence of the best and worst days on long-term equity returns and the likelihood that investors can predict when these outliers will occur. Using evidence from 15 international equity markets and over 160,000 daily returns, he concludes that:
- Black swans exist among daily equity returns at a much greater than normal frequency. For example, a $100 passive investment in the Dow Jones Industrial Average at the beginning of 1900 grows to $25,746 by the end 2006 (5.3% mean annual compound return), but:
- Missing the 10 best days (0.03% of trading days) reduces terminal wealth by 65% to $9,008 (4.3% mean annual compound return). Missing the 20 best days reduces the terminal wealth by 83% to $4,313 (3.6% mean annual compound return). Missing the 100 best days reduces terminal wealth by 99.7% to just $83 (-0.2% mean annual compound return).
- Avoiding the 10 worst days boosts terminal wealth by 206% to $78,781 (6.4% mean annual compound return). Avoiding the 20 worst days boosts terminal wealth by 532% to $162,588 (7.2% mean annual compound return). Avoiding the 100 worst days boosts terminal wealth by 43,397% to $11,198,734 (11.5% mean annual compound return).
- On average across all 15 markets over many decades, missing the 10, 20 and 100 best days reduces buy-and-hold terminal wealth by 51%, 71%, and 98%, respectively. Avoiding the 10, 20 and 100 worst days boosts terminal wealth by 150%, 373%, and 26,532%, respectively. (See the table below for more recent country by country data.)
- This evidence suggests that:
- Investors should diversify broadly to mitigate exposure to negative black swans while preserving some exposure to positive black swans.
- On a purely statistical basis, the probability than an investor can predict the black-swan days that drive wealth creation and destruction is extremely small.
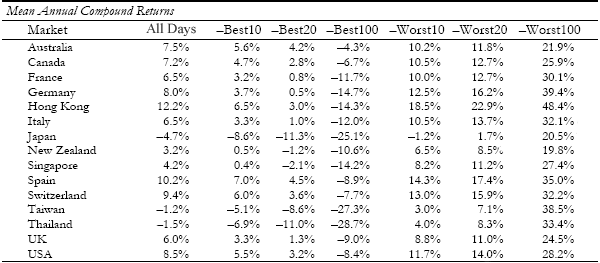
The following table, extracted from the paper, lists the mean annual compound returns for passive and black-swan timed investments in 15 country indexes over the period 1990-2006, as follows:
“All Days” lists results for passive buy-and-hold investments.
“-Best10,” “-Best20” and “-Best100” list results for missing just the best 10, 20 and 100 days.
“-Worst10,” “-Worst20” and “-Worst100” list results for avoiding just the worst 10, 20 and 100 days.
Across all countries, missing the 10 best days reduces mean annual compound returns by over 3%. Missing the 20 best days results in negative mean annual compound returns in five countries. Missing the 100 best days (only 2.34% of the trading days in a typical market) results in negative mean annual compound returns in all markets. Avoiding the 10 worst days increases mean annual compound returns by almost 4%. Avoiding the 20 worst days more than doubles mean annual compound returns. Avoiding the 100 worst days more than quintuples mean annual compound returns. Evidence from this recent period confirms that a very small number of days drive stock market returns, and investors are therefore very unlikely to predict the right days to be in and out of the market.

In summary, a few outlier trading days have a massive impact on long-term stock returns, and attempting to forecast which days is a fool’s errand.