How sensitive is the performance of the “Simple Asset Class ETF Momentum Strategy” to selecting ranks other than winners and to choosing a momentum ranking interval other than five months? This strategy each month ranks the following eight asset class exchange-traded funds (ETF), plus cash, on past return and rotates to the strongest class:
PowerShares DB Commodity Index Tracking (DBC)
iShares MSCI Emerging Markets Index (EEM)
iShares MSCI EAFE Index (EFA)
SPDR Gold Shares (GLD)
iShares Russell 1000 Index (IWB)
iShares Russell 2000 Index (IWM)
SPDR Dow Jones REIT (RWR)
iShares Barclays 20+ Year Treasury Bond (TLT)
3-month Treasury bills (Cash)
Available data are so limited that sensitivity test results may mislead. With that reservation, we perform two robustness/sensitivity tests: (1) comparison of returns for all nine ranks of winner through loser based on a ranking interval of five months and a holding interval of one month (5-1); and, (2) comparison of winner returns for ranking intervals ranging from one to 12 months (1-1 through 12-1) and for a six-month lagged six-month ranking interval (12:7-1) per “Isolating the Decisive Momentum (Echo?)”, all with one-month holding intervals. Using monthly adjusted closing prices for the asset class proxies and the yield for Cash over the period July 2002 (or inception if not available then) through April 2014 (154 months), we find that:
All calculations assume that monthly reallocation/rebalancing occurs at the close on the last trading day of each month (assuming that past returns for the ETFs can be calculated for ranking purposes just before the close).
The following chart shows average monthly 5-1 asset class momentum strategy gross returns for rank 1 (highest momentum) through rank 9 (lowest momentum) since September 2006, with one standard deviation variability ranges. September 2006 is the first month for which returns for all nine asset class proxies are available, making the sample period very short for confident inference. The chart also shows comparable statistics for an equally weighted, monthly rebalanced (EW) portfolio of the nine classes as a simple benchmark representing the value of diversification. Notable points are:
- Ranks 1, 2 and 3 have the highest average returns, and the difference in average returns between ranks 1 and 9 is positive and large. Low ranks have relatively low returns
- The decline in asset returns from rank 1 through rank 9 is not perfectly consistent.
Results support some belief in asset class momentum strategy reliability.
What happens for ranking intervals other than five months?
![]()
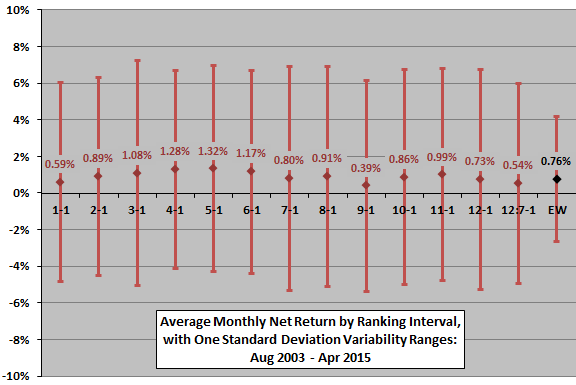
The next chart shows average monthly net returns for asset class momentum strategies 1-1 through 12-1 and 12:7-1 since August 2003 (allowing a 12-month return calculation for at least six ETFs, adding assets as they become available). The assumed level of trading (ETF switching) friction is 0.25% of the balance for all ranking intervals. Monthly EW portfolio rebalancing is frictionless for conservative benchmarking. Results suggest that:
- Ranking intervals of four to six months best fit multiple financial markets over the available sample period.
- Variation across ranking intervals is not obviously systematic, undermining belief in a stable best choice.
The available sample period is short for confident inference. For example:
It is plausible that the rate of change of economic/financial variables and the speed of trader reactions vary over time (whether somewhat predictably or randomly), such that different ranking intervals work better over different sample periods.
It is also plausible that changes and trader reactions vary across asset classes. Comparing results with those in “Simple Sector ETF Momentum Strategy Robustness/Sensitivity Tests” (for a longer sample period) suggests a longer cycle for equity sector rotation than for asset class rotation.
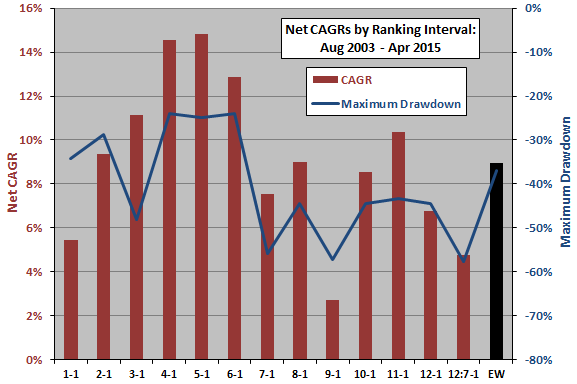
For another perspective, we look at compound annual growth rates (CAGR) and maximum drawdowns across ranking intervals.
The next chart summarizes net CAGRs and maximum (peak-to-trough) drawdowns for asset class momentum strategies 1-1 through 12-1 and 12:7-1 since July 2003. Results generally confirm that ranking intervals of four to six months work best over the sample period. The average CAGR for the 13 intervals is 9.1%. Seven of 13 ranking intervals beat (frictionless) EW. Maximum drawdowns are generally smaller in magnitude for short ranking intervals than long ones.
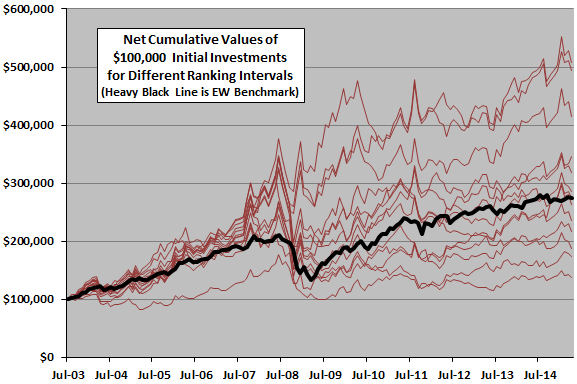
For greater depth of perspective, we compare net cumulative trajectories.
The final chart tracks net cumulative values of a $100,000 initial investments for all 13 variations in momentum ranking interval since July 2003. The chart emphasizes the large cumulative effects of varying the ranking interval.
To the extent that there is some fundamental/persistent rotation cycle, an investor using the strategy would prefer a five-month measurement interval (by a slight margin over a four-month interval). To the extent that variation across ranking intervals is random, an investor would expect the average performance of all ranking intervals (and might spread bets by using several).
In summary, evidence from momentum rank and ranking interval sensitivity tests based on small samples offer some support for belief in simple asset class ETF momentum strategy reliability. In the available sample, selecting the top one to three ranks based on a ranking interval of four to six months are among the best alternatives.
Cautions regarding findings include:
- The performance of the best (worst) ranking/ranking interval incorporates data snooping bias and therefore likely overstates (understates) expected performance.
- As noted, sample sizes (only about 21 independent five-month ranking intervals in the first test and about 13 independent 12-month ranking intervals in the second test) are very small for confident inference.
- Differences in results here from those in “Simple Sector ETF Momentum Strategy Robustness/Sensitivity Tests” and “Doing Momentum with Style (ETFs) Robustness/Sensitivity Tests” (for longer sample periods) undermine belief in any pervasively optimal momentum strategy parameters.
- The method and parameter ranges derive from early research on individual stocks. While arguable that the findings should carry over to ETFs, there might be confounding effects. For example, hedging practices (using an asset class ETF to hedge positions in individual assets from the sector) might affect translation of an anomaly from individual assets to ETFs.