What are typical magnitude and duration of short squeezes? In their March 2012 paper entitled “Short Squeeze”, Wei Xu and Baixiao Liu investigate the dynamics and determinants of short squeezes. They cite the SEC definition: “The term ‘short squeeze’ refers to the pressure on short sellers to cover their positions as a result of sharp price increases or difficulty in borrowing the security the sellers short. The rush by short sellers to cover produces additional upward pressure on the price of the stock, which then can cause an even greater squeeze.” They identify short squeeze triggers as one-day stock returns (Day 0) of at least 15%. They interpret the Day 1 reversal as the magnitude of the short squeeze. They define lagged short interest level as the ratio of the number of shares shorted as of the 12th of each month to trading volume the previous month. Using daily and 5-minute intraday stock prices and monthly short interest levels for common stocks listed listed on NYSE/AMEX/NASDAQ as of 2003, excluding very small and low-priced stocks, during 1995 through 2009 (containing 26,343 short-squeeze events), they find that:
- For stocks involved in short-squeeze events, the mean (median) short interest level is 0.18 (0.11), with bid-ask spread 1.32% (0.86%).
- The average four-factor (market, size, book-to-market, momentum) risk-adjusted Day 1 gross reversal is -0.30%. For 190 stocks in the top 10% of both short interest level and Day 0 return, the average Day 1 gross price reversal is -3.25%.
- Short squeeze impact relates positively to Day 0 stock return, short interest level, institutional holding, Day 0 market return and Day 0 industry returns. These relationships strengthen after SEC adoption of Regulation SHO in 2005.
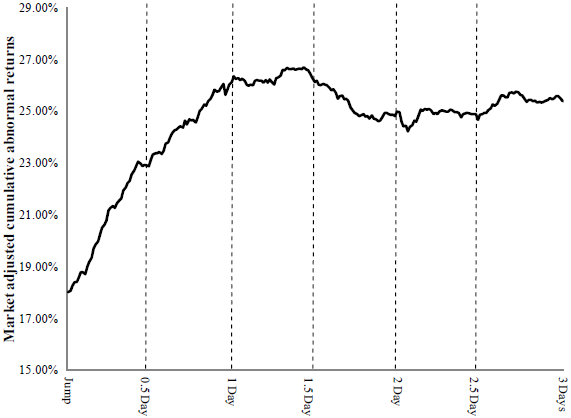
- Intraday short squeeze dynamics, based on 153 stocks in the top 10% of both short interest level and Day 0 return for which intraday price data is available (see the chart below) are:
- The price jump initiating the short squeeze averages 18%.
- Price then climbs steadily for a day and half, peaking at a 27% gain over the pre-jump price
- Price then drops steadily by about 4% of pre-jump price over the next half-day.
- Price then oscillates trendlessly.
- Results are similar after excluding events with confounding post-jump news.
The following chart, taken from the paper, tracks average market-adjusted cumulative return for 153 stocks in the top 10% of both short interest level and Day 0 return from initiating price jump to 19.5 trading hours (three trading days) after the jump. Results indicate that price tends to continue rising during the 1.5 days after the jump, adding about 50% to the jump. Part of this continuation is due to dissemination of the news causing the jump and part (indicated by the magnitude of the reversal during 1.5 days to 2.0 days after the jump) is due to a short squeeze.

In summary, evidence suggests that traders may be able to exploit systematic behaviors related to continuation and reversal of large jumps prices of stocks with high levels of short interest, partly due to slow dissemination of information and partly due to squeezing of shorts.
Cautions regarding findings include:
- Reported returns are gross, not net. As indicated by the typical bid-ask spreads, including reasonable trading frictions would substantially reduce potential trading profit. In fact, bid-ask spreads may be elevated during jumps/short squeezes and generally for stocks with high short interest levels.
- It seems plausible that technology enhancements during the sample period may compress reported dynamics over time.