Does the S&P 500 implied volatility index (VIX) behave predictably after up or down streaks? To check, we look at next-day percentage changes in VIX after up and down streaks ranging from two to seven trading sessions. To test exploitability, we repeat the analysis on the much shorter sample available for the iPath S&P 500 VIX ST Futures ETN (VXX). Using daily closes of VIX from the beginning of January 1990 and VXX from the end of January 2009, both through mid-November 2012, we find that:
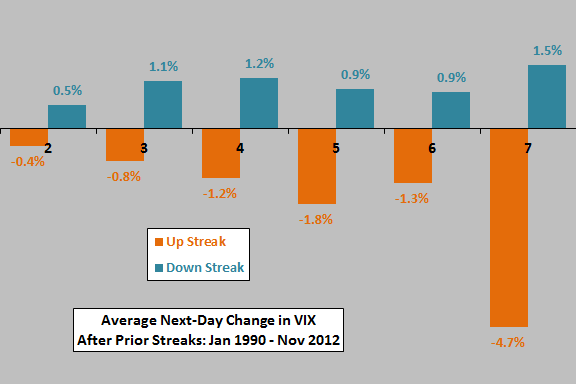
The following chart summarizes average next-day percentage changes in VIX after up and down streaks of two, three, four, five, six and seven trading sessions over the available sample period. The number of seven-day up (down) streaks is only 11 (46). The number of observations for streaks longer than seven sessions is too small for analysis. The average daily percentage change in VIX over the entire sample period is 0.19%.
Results consistently indicate that VIX tends to reverse after streaks, but the strength of reversal does not systematically increase with the length of the streak.
Is this reversion tendency exploitable via VXX?

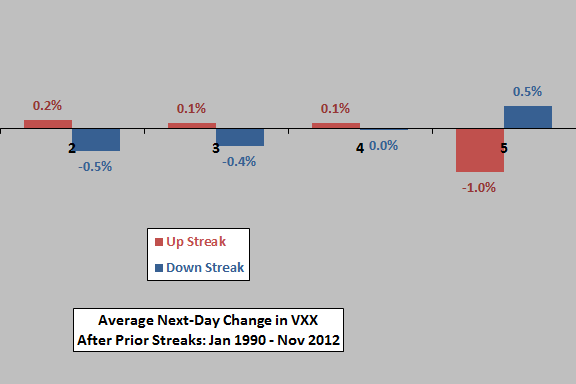
The next chart summarizes average next-day percentage changes in VXX after up and down streaks of two, three, four and five trading sessions over the available sample period. The number of five-day up (down) streaks is only 13 (72). The number of observations for streaks longer than five sessions is too small for analysis. The average daily percentage change in VXX over the entire sample period is -0.34%.
Results are very different from those for VIX. If anything, VXX exhibits some degree of momentum rather than reversion for most streak lengths. It appears that future traders anticipate the streak behaviors of VIX.

In summary, evidence from simple tests on available data indicates that VIX tends to revert after streaks, but the tendency is not exploitable via the futures-based VXX.
Cautions regarding findings include:
- As indicated, the number of observations for the longest up streaks is very small.
- The overall VXX sample is small in terms of number of VIX regimes.
See “Exploit Short-term VIX Reversion with VXX?” for closely related research on VIX reversion. See “Trade Stock Market Streak Reversals?” for similar analysis of U.S. stock market return streaks.