“Intraday U.S. Stock Market Behavior” examines behavior of the S&P 500 Index at 15-minute intervals over the trading day during each of 2007 (bullish year) and 2008 (bearish year), finding slight tendencies for market weakness during mid-afternoon and market volatility at the beginning and the end of the trading day. Does recent data confirm these findings? To investigate, we calculate average cumulative returns and standard deviations of returns for both the S&P 500 Index and SPDR S&P 500 (SPY) measured at 5-minute intervals during the trading day over the last six months. Using 5-minute levels/prices for the S&P 500 Index and for SPY during 9:30-16:00 over the period August 2012 through September 2014, we find that:
Data is missing or incomplete for 10 trading days, and the market closes at 13:00 on six others, so we exclude part or all of these days.
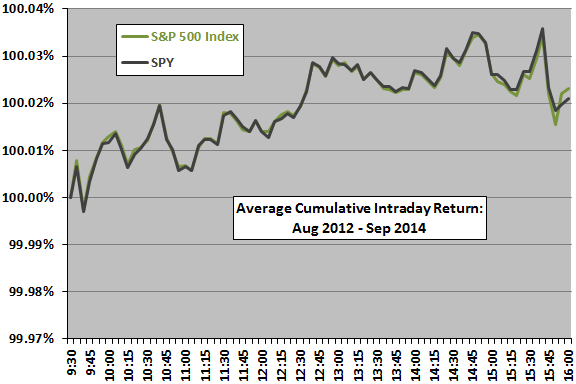
The following chart shows average cumulative returns measured at 5-minute intervals during the trading day for the S&P 500 Index and SPY over the entire sample period. Results indicate a mid-day transition higher, but variations are modest. Results do not confirm the mid-afternoon dip observed in 2007-2008 data. Tracking error for SPY relative to the index is very slight.
Is this pattern stable within the sample?
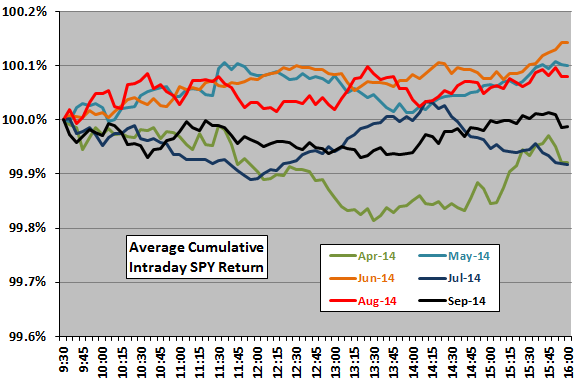
The next chart shows average cumulative returns measured at 5-minute intervals during the trading day for SPY during the last six calendar months (about 20 observations per month). Results indicate that there is no stable intraday pattern.
Do days of the week exhibit distinct patterns?
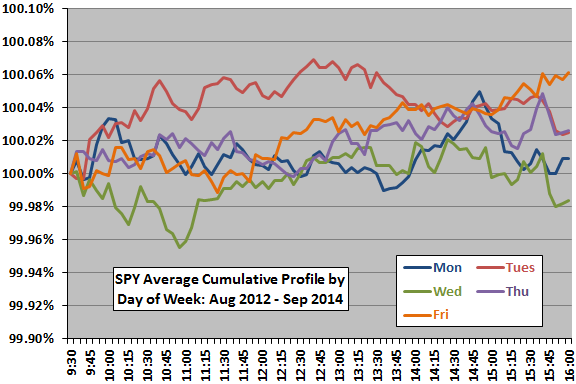
The next chart shows average cumulative returns measured at 5-minute intervals during the trading day for SPY during the days of the week over the recent sample period (about 90 observations each). Results indicate that Tuesday and Wednesday may be different from the other days.
What about intraday volatility patterns?
The final chart shows standard deviations of 5-minute returns across trading days for the S&P 500 Index and SPY over the entire sample period. Confirming results from 2007-2008 data, returns tend to be more variable at the beginning and end of the trading day. Again, differences between the S&P 500 Index and SPY are slight.
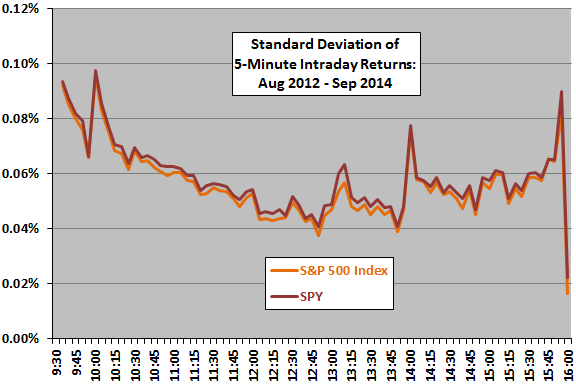
In summary, evidence from simple tests support little belief that U.S. stock market returns exhibit reliable intraday patterns (perhaps weak Mondays and Wednesdays), but does support belief that the market tends to be more volatile at the beginning and end of the trading session than in the middle.
Cautions regarding findings include:
- Monthly subsamples are small for reliable inference.
- Any wildness in high-frequency returns undermines use of conventional statistics.