Do time series carry (intrinsic value) and time series momentum (intrinsic momentum) strategies work across asset classes? What drives their returns, and how do they interact? In the January 2013 very preliminary version of their paper entitled “The Returns to Carry and Momentum Strategies: Business Cycles, Hedge Fund Capital and Limits to Arbitrage”, Jan Danilo Ahmerkamp and James Grant examine intrinsic value strategy and intrinsic momentum strategy returns for 55 worldwide futures contract series spanning equities, bonds, currencies, commodities and metals, including the effects of business cycle/economic conditions and institutional ownership. They study futures (rather than spot/cash) markets to minimize trading frictions and avoid shorting constraints. They calculate futures contract returns relative to the nearest-to-maturity futures contract (not spot/cash market) price. The momentum signal is lagged 12-month cumulative raw return. The carry (value) signal is the lagged 12-month average normalized price difference between second nearest-to-maturity and nearest contracts. They test strategies that are each month long (short) contracts with positive (negative) value or momentum signals. They also test a combination strategy that is long (short) contracts with both value and momentum signals positive (negative). For comparability of assets, they weight contract series within multi-asset portfolios by inverse volatility, estimated as the average absolute value of daily returns over the past three months. Their benchmark is a long-only portfolio of all contracts weighted by inverse volatility. Using daily settlement prices for the nearest and second nearest futures contracts of the 55 series (10 equities, 12 bonds, 17 commodities, nine currencies and seven metals) as available during 1980 through 2012, they find that:
- Over the entire sample period, the value (momentum) strategy generates a gross annualized average return of 6.1% (8.6%) and an associated Sharpe ratio of 1.3 (1.2). Momentum strategy returns are negatively skewed, indicating susceptibility to crashes. The gross annualized Sharpe ratio of the combination strategy is 1.4.
- The value (momentum) strategy generates a gross annualized one-factor alpha relative to the long-only benchmark portfolio of 6.7% (7.0%), with beta -0.1 (0.2). The combination strategy has a gross annualized alpha of 6.1% and a beta of 0.0.
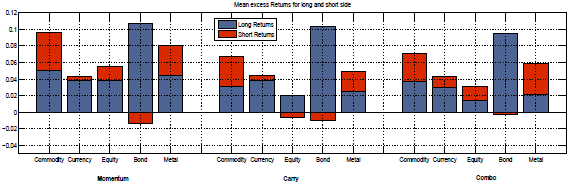
- About 75% of gross returns comes from the long sides of both the value and momentum strategies (see the chart below). About two-thirds of profitability for the combination strategy comes from the long side. However, more than half of the gross alpha comes from the short side for all three strategies.
- The correlation between value and momentum returns is 0.28, generally decreasing over the sample period. The correlation between value (momentum) strategy and benchmark portfolio returns is -0.21 (0.24).
- In general, these findings hold by asset class:
- Gross annualized returns range from 1.6% for an equities value strategy to 10.4% for a bonds momentum strategy.
- Gross annualized Sharpe ratios range from 0.1 for equities value to 1.1 for commodities momentum.
- Asset classes generally exhibit significantly positive alphas relative to the benchmark portfolio (except bonds value and momentum).
- Macroeconomic variables [dividend yield; default spread (average Moodys BAA yield minus AAA yield); 3-month U.S. Treasury bill yield; and, term spread (average 10-year U.S. Treasury note yield minus 3-month U.S. Treasury bill yield)] significantly predict value strategy returns across asset classes. Overall, the value premium tends to be high (low) when economic activity is high (low). However, the long sides of value portfolios are countercyclical.
- Hedge fund capital flows (not macroeconomic variables) relate negatively to future momentum strategy returns. In other words, an increase (decrease) in hedge fund capital reduces (boosts) next-period momentum strategy returns.
- Value (momentum) strategy returns are roughly constant (decline) over the sample period. The value (momentum) strategy tends to be more profitable when S&P 500 Index returns are high (low).
The following chart, taken from the paper, summarizes the long and short side contributions to gross average returns of the intrinsic momentum (Momentum), intrinsic value (Carry) and combination (Combo) strategies as applied to each of commodity, currency, equity, bond and metal asset classes during 1980-2012. In general long-side contributions are larger than short-side contributions, with some of the latter negative.
As noted above, however, short-side contributions to strategy alphas relative to the benchmark portfolio are generally larger than long-side contributions.
In summary, evidence indicates that intrinsic value (carry) and intrinsic momentum strategies as applied to futures are generally profitable across asset classes, and sufficiently independent that combining them is attractive.
Cautions regarding findings include:
- Returns are gross, not net. Including trading frictions would lower reported returns.
- As noted in the paper, spot/cash markets may behave differently due to higher trading frictions and shorting costs/constraints.
- Results do not account for data acquisition/processing burdens (or fund manager fees, if delegated).
See “Combining Value and Momentum Across Asset Classes” and “Combined Value-Momentum Tactical Asset Class Allocation” for related research.