Are stocks so attractive over the long run that they crowd bonds and cash out of the optimal portfolio? In their September 2013 paper entitled “Optimal Portfolios for the Long Run”, David Blanchett, Michael Finke and Wade Pfau relate optimal portfolio equity allocation to investment horizon worldwide to determine whether stocks universally exhibit time diversification (whereby mean reversion of returns causes equity risk to decrease as investment horizon lengthens). In calculating optimal equity allocation, they employ a utility function to model how investors feel about the risk of good and bad outcomes (not volatility as measured by standard deviation of returns). They consider different levels of investor risk aversion on a scale of 1 to 20, with 20 extremely risk averse. They measure returns for both overlapping and independent investment intervals of 1 to 20 years. They constrain portfolios to long-only positions in three assets: government bills (cash), government bonds and stock indexes. Using annual real returns to local investors in bills, bonds and stock indexes for 20 countries during 1900 through 2012, they find that:
- In general across countries and levels of investor risk aversion, the longer the investment horizon, the higher the optimal allocation to equities (see the charts below). Specifically, based on overlapping return intervals, the optimal equity allocation across the 20 countries increases as investment horizon lengthens by an average:
- 1.3% per year for low risk aversion (2).
- 2.1% per year for moderate risk aversion (4).
- 2.5% per year for high risk aversion (8).
- 2.7% per year for very high risk aversion (16).
- A modest tendency for two-year mean reversion in stock index returns is a key reason why equity risk falls as investment horizon lengthens (time diversifies equities).
- The value of time diversification for equities increases during the 20th century, despite a declining equity risk premium.
- As long as the equity risk premium is positive, there is some time diversification value.
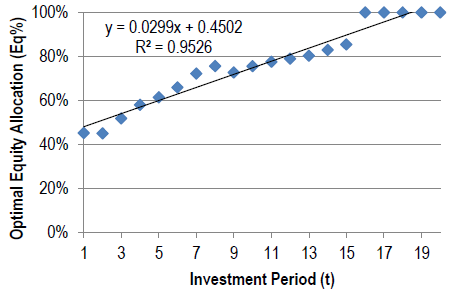
The following chart, taken from the paper, shows the relationship between optimal portfolio equity allocation and investment horizon (Investment Period) for moderately risk averse U.S. investors (risk aversion level 4). Return calculations involve overlapping investment intervals. The best-fit line has a positive slope, indicating that the allocation to stocks should increase as investment horizon lengthens. Raw calculations indicate that the optimal allocation to equities is 100% for investment horizons longer than 15 years.
Across 20 countries and risk aversion levels 2, 4, 8 and 16, similar analyses generate positive slopes (time diversification) for over 90% of scenarios.
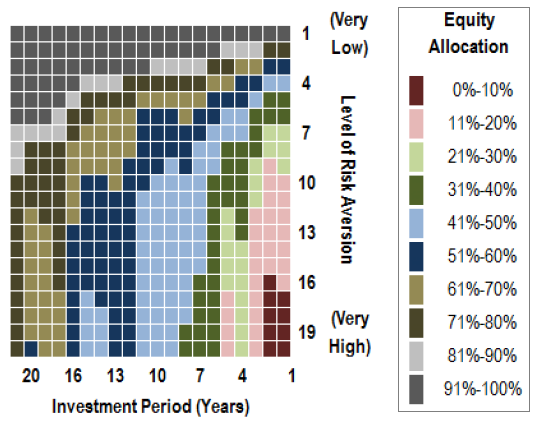
The next chart, also from the paper, summarizes optimal equity allocations for U.S. investors across levels of risk aversion from 1 to 20 and investment horizons of 1 to 20 years (400 scenarios) for overlapping return intervals. The optimal equity allocation increases as investment horizon lengthens and decreases as risk aversion increases.
Optimal U.S. equity allocations are similar to 20-country averages.
In summary, evidence generally supports belief in time diversification of equities, such that the optimal portfolio allocation to stocks increases as investment horizon lengthens.
Cautions regarding findings include:
- Even a 113-year sample has only about 5.6 independent 20-year investment intervals. The sample is especially short for analysis of any trend in time diversification value.
- The study uses stock indexes, not accounting for the costs of creating and maintaining tradable assets to track them. Incorporating these costs could affect findings.
- The study does not account for the costs of implied annual rebalancing of portfolio components to target weights.
See also “Long-term Investors: Focus on Terminal Wealth?”.