Does short-term (one-month) stock return reversal persist? If so, is there a best way to refine and exploit it? In their March 2012 paper entitled “Short-Term Return Reversal: the Long and the Short of It”, Zhi Da, Qianqiu Liu and Ernst Schaumburg decompose the total short-term reversal into an across-industry component (long prior-month loser industries and short prior-month winner industries) and a within- industry component (long prior-month loser and short prior-month winner stocks within each industry). They then further decompose the within-industry return reversal into three components related to: (1) variation in three-factor (market, size, book-to-market) expected stock returns; (2) underreaction/overreaction to within-industry cash flow news (relative to analyst forecasts); and, (3) a residual component attributable to discount rate news/liquidity shocks. Using monthly data for a broad sample of relatively large and liquid stocks accounting for about 75% of U.S. equity market capitalization over the period January 1982 through March 2009, they conclude that:
- When isolated from a counteracting cash flow news effect, monthly stock return reversal is pervasive, persistent and substantial, attributable largely to liquidity shocks on the long side and investor overreaction to discount rate news on the short side.
- Over the entire sample period, a short-term reversal hedge strategy that is long (short) the tenth of biggest prior-month (winners) generates an average gross monthly raw return (three-factor alpha) of :
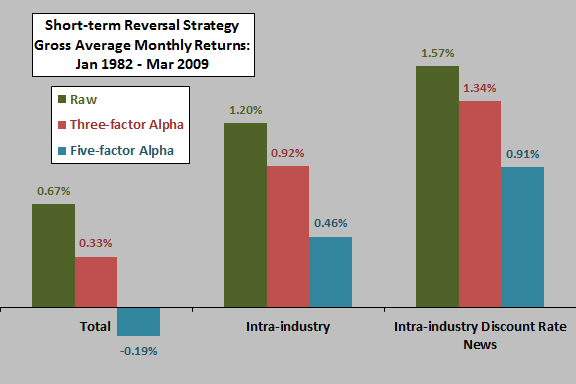
- 0.67% (0.33%) when applied to all stocks in the sample.
- 1.20% (0.92%) when applied to stocks on an intra-industry basis.
- 1.57% (1.34%) when applied to stocks sorted intra-industry based on prior-month discount rate/liquidity news (residual of prior-month return minus expected return minus cash flow news), economically significant for a conservatively estimated monthly trading friction of 0.80%.
- A simple way of inferring discount rate shocks is to look for stocks with prices and earnings forecasts moving in opposite directions (an intra-industry double-sort, first on prior-month stock returns and then on prior-month earnings forecast revisions). A hedge strategy that is long (short) past losers (winners) with upward (downward) forecast revisions, reformed monthly, generates an average gross monthly raw return of 1.86% and three-factor alpha of 1.72%.
- Reversal gross profit and its discount rate component are larger among small and illiquid stocks with little analyst coverage, consistent with an important role for liquidity.
- Results are robust to various industry classification methods, subperiods and exclusion of January returns. Results also generally hold for each individual industry and across subsamples formed on size and book-to-market ratio.
The following chart, constructed from data in the paper, summarizes raw and riskadjusted returns over the entire January 1982 through March 2009 sample period for three hedge trading strategies:
- The Total strategy holds equally weighted long (short) positions in the stocks of the bottom (top) decile of prior-month returns for the entire sample, reformed monthly.
- The Intra-industry strategy similarly buys (sells) prior-month return loser (winner) deciles within each industry.
- The Intra-industry Discount Rate News strategy buys (sells) stocks in the bottom (top) decile of prior-month discount rate news within each industry.
The three-factor alpha adjustment incorporates market, size and book-to-market factors. The five-factor adjustment adds a momentum factor and a total short-run reversal factor (hence eliminating alpha for the total sample).

In summary, evidence indicates that investors may be able to isolate the most profitable short-term reversal opportunities by ranking discount rate shocks (estimated by stock prices and earnings forecasts moving in opposite directions) within industries.
Cautions regarding findings include:
- Reported returns are gross, not net. Including reasonable trading frictions, which vary considerably over the sample period, would reduce these returns.
- The tested strategies involve many holdings and high monthly portfolio turnover, and many investors may not have been able to achieve estimated monthly trading friction of 0.80%.
- Testing multiple strategies against the same data set introduces data snooping bias, such that the best result likely overstate reasonable out-of-sample expectations.