What is the global financial asset allocation? In their November 2013 paper entitled “The Global Multi-Asset Market Portfolio 1959-2012”, Ronald Doeswijk, Trevin Lam and Laurens Swinkels construct the aggregate portfolio of all investors encompassing market capitalizations for eight asset classes: equities, private equity, real estate, high-yield bonds, emerging markets debt, investment-grade credits (corporate bonds and mortgage-backed securities), government bonds and inflation-linked bonds. They exclude human capital (earned income streams), durable goods (such as cars), residences and family businesses. They exclude commodities because the net position in commodity futures is zero. They suggest that these aggregate allocations represent a natural benchmark portfolio for financial investors. Further, they trace the evolution of allocations to the eight asset classes during 1990 through 2012, and the evolution of allocations to equities, real estate, non-government bonds and government bonds during 1959 through 2012. Using a variety of data sources and estimation methodologies, they find that:
- At the end of 2012, world financial market capitalizations total $90.6 trillion, as follows:
- Equities – $32.9 trillion (36%)
- Government bonds – $27 trillion (30%)
- Investment-grade credits – $17 trillion (18%)
- Other asset classes – $14 trillion (16%), ranging from $1.5 trillion (2%) for high-yield bonds to $4.6 trillion (5%) for real estate.
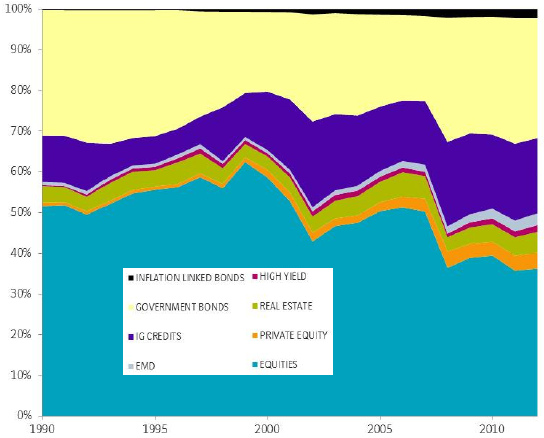
- During 1990-2012 across the eight asset classes (see the chart below), the weight in the global market portfolio for:
- Equities generally declines from 52% to 36%.
- Investment-grade credits rises from 11% to 18%.
- The five smallest asset classes rises from 6.2% to 16%.
- During 1959-2012 across the four main asset classes only, the weight for:
- Equities falls from 51% to 38%, close to the 37% low in 2011. The maximum weights for equities are 63% in 1999 and 64% in 1968. Average weight is 52%.
- Government bonds rises from 30% to 36%, close to the 37% high in 1982. Average weight is 30%.
- Non-government bonds rises from 18% to 21% in 2012. Average weight is 15%.
- Real estate rises from 1.4% to 5.3%. Average weight is 3.2%.
The following chart, taken from the paper, traces weights within the global market portfolio from 1990 through 2012. EMD is emerging markets debt. The weight for equities is now near an historic low, while that of investment-grade credits (IG) is near a high.
In summary, evidence suggests that equities are near historic lows in the global financial assets portfolio.
Cautions regarding findings include:
- Some investors may not have cost-effective access to all eight asset classes.
- As noted, the global allocation excludes commodities based on the argument that the net futures position is zero. Investors, however, may set allocation targets to commodities that are distinct in nature from the counter-positions of commercial hedgers.
- The current unusually low equities allocation may be a consequence of recent financialization of alternative asset classes via exchange-traded funds and notes, therefore representing more a permanent shift than a rebalancing opportunity.