Is there a simple compromise between easy-to-implement market weights and more diversified equal sector and equal stock weights? In their December 2013 paper entitled “A Simple Diversified Portfolio Strategy”, Bernd Hanke and Garrett Quigley present a stock portfolio construction approach that blends market weights, equal stock weights and equal sector weights. The objectives of the approach (relative to market weights) are: (1) higher returns (by capturing more of the diversification premium); (2) lower risk (via increased diversification); and, (3) competitive capacity and rebalancing frictions (by limiting the tilt toward small, illiquid stocks). In testing this approach, they form and rebalance annually regional (U.S., European and Japanese) portfolios of relatively liquid stocks. They ignore rebalancing frictions. They define sectors via the broadest Global Industry Classification Standard level (ten sectors). Using total (dividend-reinvested) returns, market capitalizations and sector memberships for a broad sample of relatively liquid stocks during January 1992 through March 2013, they find that:
- Market-weight stock portfolios skew strongly toward the largest companies and “hot” sectors.
- The ten stocks with the largest market capitalizations (top 2%) comprise nearly 20% of aggregate S&P 500 Index capitalization.
- During the late 1990s, the technology sector comprised more than a third of total U.S. stock market capitalization.
- An approach that tilts stock portfolios from market weights and toward equal stock and/or equal sector weights mitigates the negative relationship between market weight and future return. Specifically (see the charts below):
- Tilting toward a combination of equal stock and equal sector weights outperforms market weights by up to 2% per year. Outperformance increases about linearly with degree of tilt away from market weights. Tilting toward equal sector weights generally contributes more to outperformance than tilting toward equal stock weights.
- Tilting toward a combination of equal stock and equal sector weights produces portfolio volatility similar to that of market weights. Tilting toward equal stock (sector) weights alone mostly tends to increase (decrease) portfolio volatility commensurate with the degree of tilt.
- Tilting toward a combination of equal stock and equal sector weights consistently produces portfolio reward-to-risk ratios materially greater than that of market weights. For a given degree of tilt, tilting toward equal sector weights outperforms tilting toward equal stock weights, and both underperform combined tilts.
- Maximum drawdown is nearly always deeper for market weights than for separate and combined tilts toward equal sector and equal stock weights.
- Except for pure equal weights, separate and combined tilts toward equal sector and equal stock weights generally drive only modestly higher annual turnover than market weights.
- In all three regions, tilting toward a combination of equal stock and equal sector weights generates positive four-factor (market, size, book-to-market, momentum) alphas. These alphas are statistically significant for the U.S. and Europe.
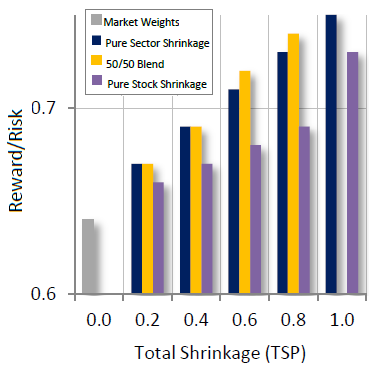
The following chart, taken from the paper, summarizes annual gross reward-to-risk (return-to-volatility) ratios for four portfolios and different levels of tilt (shrinkage) from market weights to equal weights as applied to relatively liquid U.S. stocks over the sample period:
- Market Weights (gray column) – applicable only for zero tilt.
- Pure Sector Shrinkage (dark blue columns) – tilts ranging from 20% (0.2) to to 100% (1.0) toward equal sector weights only. 100% tilt means pure equal sector weights.
- 50/50 Blend (yellow columns) – tilts ranging from 20% to to 80% applied equally toward both equal sector and equal stock weights.
- Pure Stock Shrinkage (light purple columns) – tilts ranging from 20% to to 100% toward equal stock weights only. 100% tilt means pure equal stock weights.
Results indicate that tilts toward equal sector weights and the blend of tilts toward equal sector and equal stock weights progressively outperform market weights on a gross basis. However, vertical scale truncation exaggerates outperformance. Portfolio turnover does not rise substantially with tilt, except for 100% tilt toward pure equal stock weights.
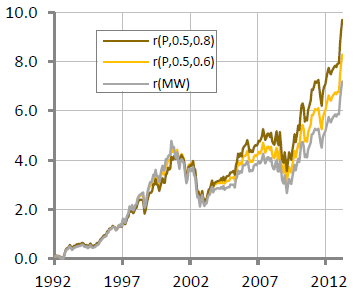
The next chart, also from the paper, compares gross cumulative returns for three portfolios applied to relatively liquid U.S. stocks over the sample period:
- r(P,o.5,0.8) (green line) – a tilt of 80% applied equally toward both equal sector and equal stock weights (the 50/50 Blend above).
- r(P,o.5,0.6) (yellow line) – a tilt of 60% applied equally toward both equal sector and equal stock weights.
- r(MW) (gray line) – market weights
The tilted portfolios generally outperform market weights, except during the technology boom of the late 1990s (when market concentration dominates market diversification). More tilt means greater outperformance.
In summary, a stock diversification strategy that moderately tilts market weights toward equal stock and (especially) equal sector weights may be a practical way to enhance capture of the equity risk premium compared to market weights.
Cautions regarding findings:
- Reported performance statistics are gross, not net. Accounting for rebalancing frictions would degrade these statistics (though annual rebalancing mitigates this concern).
- Moreover, the modestly higher turnover of tilted portfolios at least partially offsets their enhanced gross performance. Based on the universe of stocks considered, the authors assert that investors “can safely dismiss the possibility that the return advantage will be eliminated by transaction costs or that it is attributable to a micro-cap effect.”
- As noted in the paper, for example during the late 1990s, there may be multi-year periods when market weights beat tilted weights.
- The paper addresses equities only (but may apply to other asset classes).