In the preface to his 2014 book entitled Investing with the Trend: A Rules-Based Approach to Money Management, author Greg Morris, Chairman of the Investment Committee and Chief Technical Analyst for Stadion Money Management LLC, states: “This book is a collection of almost 40 years of being involved in the markets, sharing some things I have learned and truly believe… You will discover early that sometimes I might seem overly passionate about what I’m saying, but hopefully you will realize that is because I have well-formed opinions and just want to ensure that the message is straightforward and easily understood. It is not only a book on trend following but a source of technical analysis information… If I had to nail down a single goal for the book, it would be to provide substantial evidence that there are ways to be successful at investing that are outside the mainstream of Wall Street. Although it will appear my concern is about modern finance, it is actually directed toward the investment management world and its misuse of the tools of modern finance.” Based on his 40 years of experience and supporting analyses, he concludes that:
From Chapter 1, “Introduction” (Page 1): “I know that when dealing with the unknown such as analysis of the stock market, you absolutely cannot speak in absolutes. I also know that random guessing about what to do in the market is a quick path to failure. …Any process is better than no process, or even worse, a random or constantly changing process.”
From Chapter 3, “Flaws in Modern Financial Theory” (Page 27): “Personally, I think modern finance is almost a hoax, an area of investments that has proliferated into a gigantic sales pitch.”
From Chapter 4, “Misuse of Statistics and Other Controversial Practices” (Pages 54-55): “The inputs that are needed [for Modern Portfolio Theory] are expected future returns, volatility, and correlations. The industry as a whole took the easy approach to solving this by utilizing long-term averages for the inputs. …Those long-term inputs are totally inappropriate for the investing horizon of most investors…”
From Chapter 5, “The Illusion of Forecasting” (Pages 57, 62): “…I adamantly believe there is no one who knows what the market will do tomorrow, next week, next month, next year, or at any time in the future–period. …Most advisors and especially their clients get caught up in the moment and are easily swayed into believing that some expert actually knows the future.”
From Chapter 6, “The Enemy in the Mirror” (Page 72): “I am often asked for advice from young traders or investors. The consistent and most stressed thing I tell them is to learn about yourself. Understanding behavioral biases will help accomplish that.”
From Chapter 7, “Market Facts: Bull and Bear Markets” (Page 84): “…we study the past so that when similar events unfold in the market, we just might be able to recognize them and know what can possibly happen. Remember, markets constantly change, but people rarely do.”
From Chapter 8, “Market Facts: Valuations, Returns, and Distributions” (Pages 113-114): “…when the financial news noise is constantly parading analysts by touting the PE as overvalued or undervalued, you can count on the fact that they are using the forward PE ratio. The forward ratio is the guess of all the earnings analysts. They are rarely correct. Ignore them.”
From Chapter 9, “Why Technical Analysis” (Pages 143-144, 157): “…the art of technical analysis is to identify trend changes at an early stage and to maintain an investment position until the weight of the evidence indicates that the trend has reversed. …It is primarily used two ways: predictive and reactive. …React, don’t predict. …the absolute most important thing technical analysis does is it gives us discipline. …I believe in technical analysis because of its close relationship to the supply and demand of the market. …Choose some good reliable indicators and stick with them. Learn how they respond during different market environments and master the interpretation of them. And remember, when your favorite indicator fails you, avoid thinking that this time is different, it probably is not.”
From Chapter 10, “Market Trend Analysis” (Pages 159, 163, 230): “Trends in markets are generally caused by short-term supply and demand imbalances with a heavy overdose of human emotion. …Trend following is somewhat similar to a momentum strategy except for two significant differences. One, momentum strategies generally rank past performance for selection, and two, often they do not utilize stop-loss methods… …both rely on the persistence of price behavior. …In order to be a trend follower you must first determine the minimum length trend you want to identify. You cannot follow every little up and down move… Some issues trend better when in uptrends than downtrends, while the reverse holds true for some.”
From Chapter 11, “Drawdown Analysis” (Page 231): “Volatility can contribute to risk, but it can also contribute to price gains. Loss of capital is simple and reasonable to use as a risk measure…risk is defined by drawdown.”
From Chapter 13, “Measuring the Market” (Pages 281, 283-284): “I have been fond of a weight of the evidence approach for more than 30 years. …Now, the technical, trend-following measures that make up the weight of the evidence consist of price, breadth, and relative strength indicators. …When evaluating indicators to be considered for trend following, you cannot optimize over long-term periods and then just pick the best performing parameter. That is a guarantee of failure and probably quite soon. …One area of value is to plot all of a parameter’s performance and look for plateaus…where the parameter performed steadily over a range of similar values. Picking a spike…is the worst thing you can do as the parameter surrounding the spike are probably closer to where you will see the actual results. …Indicators need to be evaluated over cyclical bull and bear markets, secular markets, periods covering calendar-based times, randomly selected periods, and almost any other period selection process you may want to try. …Ideally, you want to test the indicators with a certain portion of your data, get the parameters that work well, and then check it on the remaining portion of your data. …If the indicator continues to perform on the previously unused data, then you probably have something.”
From Chapter 14, “Security Ranking, Selection, Rules, and Guidelines” (Pages 319, 354): “Keep it simple, turn off the outside noise, and use a technical approach to determine which issues to buy and sell. …This chapter contains many measures one can use to determine which holdings should be bought. There were some that were identified as mandatory measures, which means these are the ones that have the best track record at identifying early when a holding is in an uptrend. …Just keep in mind what the goal of this is: to remove human input into the selection process.”
From Chapter 15, “Putting It All Together: The ‘Dancing with the Trend’ Model” (Page 389): “The Dance with the Trend model measures the trend of the market, then utilizes rules to scale into the trend, and maintains risk containment measures (stop loss) both absolute and relative, and when an uptrend is not identified, a cash position of up to 100 percent is utilized. …the use of stop loss measures will reduce the downside variance and shift the return distribution mean to the right. …the baggage of trend following, known as whipsaws…, will reduce the upside variance and shift the return distribution mean to the left. The benefit is that the mean shift to the right is much greater than the mean shift to the left, yielding a net shift to the right.”
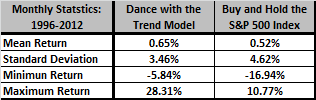
[The following table, extracted from Chapter 15, compares monthly performance statistics for a Dance with the Trend model to those for buying and holding he S&P 500 Index during 1996 through 2012. The accompanying text in the book does not elaborate on whether Dance with the Trend model results are from real-time experience or a backtest (with potential for data snooping bias). Presumably, this comparison accounts for dividends but not the trading frictions involved in Dance with the Trend model execution or any costs of maintaining a liquid fund that tracks the S&P 500 Index.]
From Chapter 16, “Putting Trend-Following to Work” (Pages 394-395): “…let me show you a specific trend following price indicator. This is a classic variation of common approaches. We call it ‘adaptive trend.’ Since it’s proprietary I can’t tell you the exact formula but here’s what it is: it is a midpoint moving average with a volatility-adjusted average true range band around it as a buy/sell trigger. As volatility and range expands the lower bound band tightens up for quicker exits and the exact [opposite] happens for smooth trends… Our Adaptive Trend indicator averages about four to five trades per year while only being invested approximately 60 percent of the time, [with annualized] return of about 14 percent from 1971 to 2012 (versus 8 percent for the Nasdaq). It has a peak drawdown of 30 percent, and an Ulcer Index (risk) of 7.5, which is about 20 percent of the risk buy-and-hold carries with the Nasdaq Ulcer Index of 35. Our results include no return on cash and do not factor in for trading costs and slippage. Based on our actual trading data using ETFs for many years, our actual costs vary between 10 and 20 basis points per year.” [The results described are apparently for a backtest, with potential for data snooping bias. Trading frictions experienced in recent years are likely not representative of those experienced early in the specified sample period. Many investors may not be able to achieve the costs reported by the author. Results do not account for any tax implications of trading.]
From Chapter 17, “Conclusions” (Page 400, 407): “Investing is not unlike an airplane in battle: Protect the assets from destruction, such as large losses (drawdown), and the investor will live to invest again. …there are many techniques for investing, but until you grasp full control over your emotions and have exemplary discipline you will probably fail.”
In summary, investors interested in trend following may find Investing with the Trend a useful buildup of a trend-following strategy derived from the author’s long experience as a technical analyst.
Cautions regarding conclusions include:
- The presentation of performance potentials for trend-following in the final chapters of the book is not complete enough to assess the potential for data snooping bias in tests, and may be optimistic regarding costs of strategy implementation. As noted, recent experience with implementation costs likely underestimates contemporaneous costs for extended backtests.
- Experienced market technicians may find much of the book a review, with the last few chapters being of greatest interest.
- Some readers may experience logical discomfort with the distinction in the book between use of past data for reaction versus prediction. Is there really a difference between the following two statements that imply the same action for an active investor?
- “The weight of evidence from my favored trend indicators is that the market is now in an uptrend that I expect to exhibit exploitable persistence.”
- “I predict the market will go materially higher [perhaps with some probability qualifier].”