Does a stronger stock price trend, up or down, indicate a bigger momentum effect? In their February 2014 paper entitled “Trend Salience, Investor Behaviors and Momentum Profitability”, Paul Docherty and Gareth Hurst test variations of a conventional stock momentum strategy that consider both past returns and rate of change of past returns relative to other stocks. Specifically, each year they reform a universe of the 500 stocks listed on the Australian Stock Exchange with the largest market capitalizations. Then each month, they rank stocks in the current universe based on past cumulative returns, designating the top fifth (quintile) as winners and bottom quintile as losers. They then further categorize each winner (loser) stock as salient if the ratio of its geometric mean return over the past 3, 6 or 9 months to its geometric mean return over the past 12 months is greater (less) than the quintile median of this ratio. Finally, they each month form equally weighted momentum and salience portfolios (with a skip-month between ranking and portfolio formation) and hold for overlapping intervals of 3, 6, 9 or 12 months. These portfolios include:
- Conventional momentum: long (short) the winners (losers).
- Salient momentum: long (short) salient winners (salient losers).
- Non-salient momentum: long (short) non-salient winners (non-salient losers).
Using monthly return data for the specified Australian stocks during January 1992 through December 2011, they find that:
- Salient momentum consistently outperforms conventional momentum which, in turn, outperforms non-salient momentum. Specifically, across variations in formation and holding intervals over the entire sample period:
- Salient winners (losers) significantly outperform (underperform) non-salient winners (losers). For example, the average gross monthly return for salient (non-salient) winners based on a 6-month salience measurement interval and a 6-month holding interval is 1.47% (0.71%).
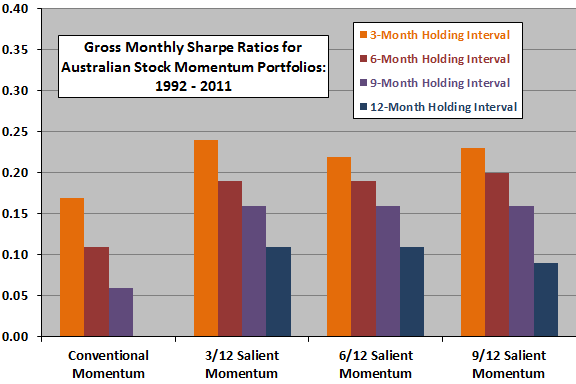
- Salient momentum hedge portfolios consistently generate higher gross Sharpe ratios than conventional momentum hedge portfolios (see the chart below). For example, the average gross monthly Sharpe ratio for salient (conventional) hedge portfolios based on a 6-month salience measurement interval and a 6-month holding interval is 0.19 (0.11).
- On average, salient momentum hedge portfolios generate a positive four-factor (market, size, book-to-market and momentum) alpha.
- Salient momentum is more persistent than non-salient momentum. For example, gross average returns for salient (non-salient) hedge portfolios based on a 6-month salience measurement interval are significantly positive for 9 (only 2) months after portfolio formation.
- Salient momentum superiority over conventional momentum is robust across size-sorted portfolios and across for all five year holding periods except 2007 through 2011. The strongest calendar months for both salient and conventional momentum are May and June, and the weakest is July.
The following chart, constructed from data in the paper, summarizes average gross monthly Sharpe ratios for four sets of hedge portfolios formed annually as described above and held for 3, 6, 9 or 12 months:
- “Conventional Momentum” is long (short) the winners (losers).
- 3/12, 6/12 and 9/12 “Salient Momentum” is long (short) salient winners (salient losers) for salience measurement intervals of 3, 6 and 9 months, respectively.
Results indicated that salient momentum strategies consistently outperforms comparable conventional momentum strategies on a gross risk-adjusted basis. The length of the salience measurement interval is not decisive, but shorter holding intervals outperform longer ones (but turnover and trading frictions would be higher for shorter holding intervals).
In summary, evidence from Australian stocks over a 20-year sample period indicate that selecting the past winners and losers with the strongest price trends enhances momentum strategy performance.
Cautions regarding findings include:
- Reported returns are gross, not net. Including trading frictions and costs of shorting would reduce these returns. Moreover, loser stocks contributing strongly to hedge momentum portfolio performance may be very costly or impossible to borrow.
- Australian stocks differ from U.S. stocks, tending toward smaller size and higher institutional/foreign ownership. These difference may be material to findings.
- The sample period is not long, especially in terms of momentum strategy performance by market state or calendar month.
- Stock-level findings may not translate to diversified aggregations such as mutual funds or exchange-traded funds.
See also “Buying on Impulse (Change in Momentum)”, “Exploiting Momentum While Avoiding Long-term Reversal” and “Stock Price Acceleration as a Momentum Investing Enhancement”.