Does the reward for taking the risk of holding stocks exhibit any long-term trend? In his April 2014 presentation package entitled “The Incredible Shrinking ‘Realized’ Equity Risk Premium”, Claude Erb examines the trend in the realized U.S. equity risk premium (ERP) since 1925. He defines this ERP as the retrospective difference in 10-year yield between the broad U.S. stock market and the 10-year yield on safe assets such as U.S. Treasury bills or intermediate-term U.S. Treasury notes. Using 10-year returns for U.S. stocks and various alternative safe assets (bills, notes and bonds) during 1925 through 2013, he finds that:
- Based on a best-fit straight line, ERP declines over the sample period.
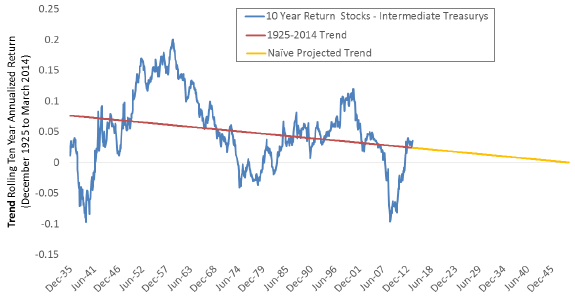
- Extrapolation of this line suggests a zero ERP by 2050 (see the chart below).
- The trend may explain the long-term decline in the equity share of the global market portfolio.
- Based on a yield of 1.6% for 5-year U.S. Treasury notes, ERP at the end of 2013 is a little above trend at about 5%.
- The gap between the CAPE earnings yield (inverse of the cyclically adjusted price-earnings ratio) and the yield on safe assets also generally declines over the sample period, such that stocks become less “overvalued.”
- The lower the ERP, the greater the probability that safe (bond-like) assets will outperform stocks.
The following chart, taken from the presentation, shows the straight-line trend in U.S. ERP, defined as the difference in 10-year rolling returns between the broad U.S. stock market and intermediate-term U.S. Treasury notes. The trend line slopes downward, such that simple extension indicates a zero ERP about 2050.
In summary, evidence suggests that the realized U.S. equity risk premium is shrinking, such that bond-like assets are increasingly appealing relative to stocks.
Cautions regarding findings include:
- The number of independent 10-year measurement intervals in the sample period is only about nine.
- A plausible interpretation of the ERP graph is that the sample period encompasses just two to three cycles of some underlying variable, such as interest rates, rather than a number of years.