Is there a practical way to mitigating data snooping bias while exploring optimal parameter values? In his February 2014 paper entitled “Know Your System! – Turning Data Mining from Bias to Benefit through System Parameter Permutation” (the National Association of Active Investment Managers’ 2014 Wagner Award winner), Dave Walton outlines System Parameter Permutation (SPP) as an alternative to traditional in-sample/out-of-sample cross-validation and other more complex approaches to compensating for data snooping bias. SPP generates distributions of performance metrics for rules-based investment strategies by systematically collecting outcomes across plausible ranges of rule parameters (see the figure below). These distributions capture typical, optimal and worst-case outcomes. He explains how to apply SPP to estimate both long-run and short-run strategy performance and to test statistical significance. He provides an example that compares conventional in-sample/out-of-sample testing and SPP as applied to an asset rotation strategy based on relative momentum. Using logical arguments and examples, he concludes that:
- SPP uses available data more efficiently (lower standard error) than conventional cross-validation because it requires no sequestering of out-of-sample data.
- Instead of binary pass/fail, SPP offers probabilistic decision making by exposing a range of potential strategy outcomes.
- SPP support testing of both long-run expectations and short-term exposures (by applying it repeatedly to short blocks of data from the overall sample). Short-term analysis generates relatively wide ranges of expected performance useful for deciding periodically whether the strategy has broken down.
- Applying SPP to a relative momentum strategy involving ten liquid exchange-traded funds (ETF) during November 2005 through May 2013 indicates that: (1) long-term analysis indicates that the general strategy outperforms a buy-and-hold benchmark; (2) but, short-term worst case analysis indicates the possibility of substantial temporary underperformance and even negative short-run absolute returns. This example encompasses outcomes for 4,224 parameter combinations, as follows:
- Momentum measurement intervals ranging from 60 to 251 trading days in increments of 10%.
- Numbers of assets to be held ranging from two to five.
- Monthly portfolio reformation points ranging from five trading days before to five trading days after end of the month.
- Catastrophic stop-loss thresholds ranging from 10% to 20% in increments of 2%.
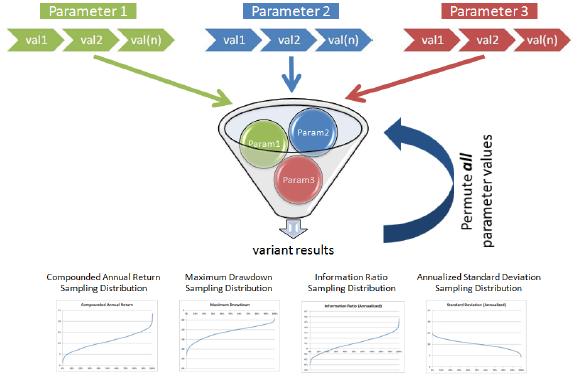
The following figure, taken from the paper, summarizes how to apply SPP to a rules-based trading strategy in four steps to generate four performance metric distributions:
- Determine plausible ranges and within-range increments for rule parameters.
- Specify the values of each parameter to be tested across its plausible range.
- Run portfolio-level backtests for all possible combinations of parameter values over selected sample period(s) and collect key strategy performance metrics from all these backtests.
- Create a cumulative distribution of all outcomes for each performance metric.
Use the median value of each metric as the best, unbiased performance estimate. Use the best (worst) outcomes to estimate optimal (worst-case) performance.
In summary, System Parameter Permutation may help investors choose and implement trading strategies by providing both a realistic expected performance and deeper understanding of the range of potential outcomes.
Cautions regarding conclusions include:
- As noted in the paper, selection of plausible parameter ranges for SPP involves judgment, and changing these ranges after testing commences injects snooping bias.
- Deciding when to apply parameter ranges to aspects of a rule-based strategy also involves judgment. In the example, the author chooses not to vary the portfolio reformation frequency (monthly). He also chooses not to consider other assets than the ten ETFs initially specified (perhaps not strictly rule-based). Results are therefore specific to monthly reformation and the small asset universe.
- SPP as outlined treats all parameter settings as equal. Some parts of a plausible parameter range may be more likely than others.
- SPP may be beyond the programming and data handling reach of many investors, or costly if delegated.
For a related analysis, see the somewhat simpler “Estimating Snooping Bias for a Multi-parameter Strategy”. See also Chapter 3: “Avoiding or Mitigating Snooping Bias”.