Is implied volatility of implied volatility, interpretable as a measure of changes in investor fear level, a useful indicator of future stock market returns or VIX futures returns? To investigate, we examine relationships between the CBOE VVIX Index, a measure of the expected volatility of the 30-day forward level of the S&P 500 Implied Volatility Index (VIX) derived from prices of VIX options, and future returns for SPDR S&P 500 (SPY)and iPath S&P 500 VIX Short-Term Futures (VXX). Using daily levels of VVIX and daily adjusted closes for SPY and VXX as available during January 2007 (VVIX inception) through mid-August 2015, we find that:
VXX inception is the end of January 2009, so measurement of the VVIX-VXX relationship is especially limited in terms of market environments.
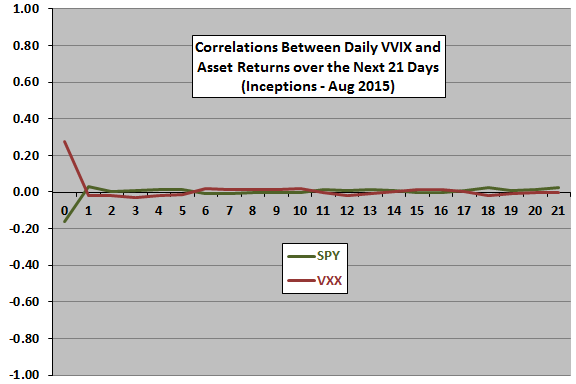
The following chart relates daily level of VVIX to returns for SPY and VXX for each of 0 (coincident) to 21 trading days later over available sample periods. The non-predictive coincident correlations stand out. There is slight indication of a positive (negative) relationship between VVIX and SPY (VXX) returns over the next five trading days.
Might daily change in VVIX be more informative?
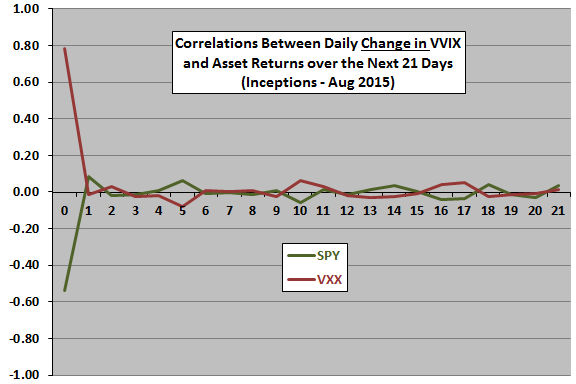
The next chart relates daily change in VVIX to returns for SPY and VXX for each of 0 (coincident) to 21 trading days later over available sample periods. Leading relationships for change in VVIX appear to be noisier and less streaky than those above, undermining belief that change in VVIX has linear relationships with future returns for the stock market or VIX futures.
Might there be exploitable non-linear relationships not exposed by correlations?
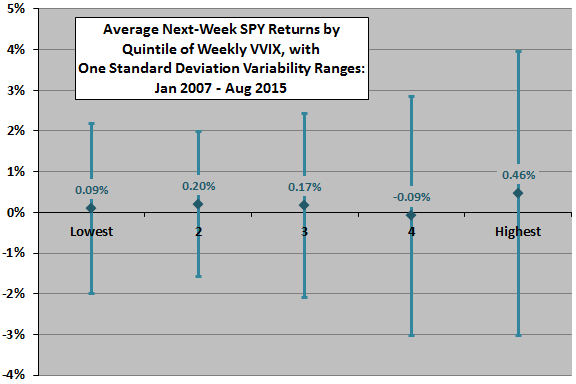
Since the first chart above suggests the possibility that daily VVIX has weak relationships with future SPY returns and VXX returns that persist for a week, we shift to a measurement interval of five trading days. We winnow the data so that five-day intervals do not overlap.
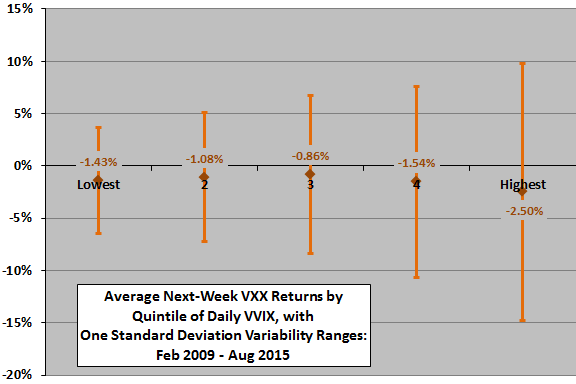
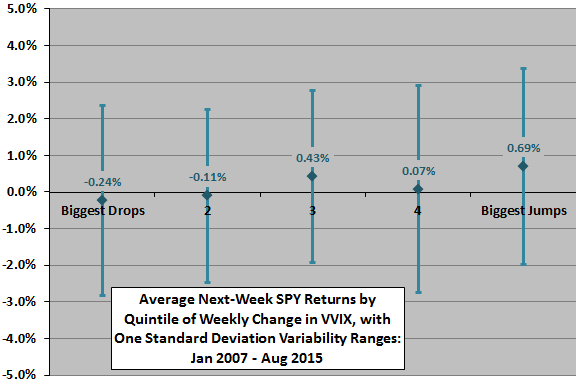
The next two charts summarize average next-week SPY (upper chart) and VXX (lower chart) returns and return variabilities by ranked fifth (quintile) of VVIX. There are 87-88 (65-66) observations per quintile for SPY (VXX).
Confirming the correlation analyses, the charts do not exhibit systematic progressions in average returns across quintiles. Tail effects include:
- High volatility and high average return for next-week SPY when VVIX is high.
- High volatility and low average return for VXX when VVIX is high.
Might might there be useful non-linear relationships with change in VVIX?
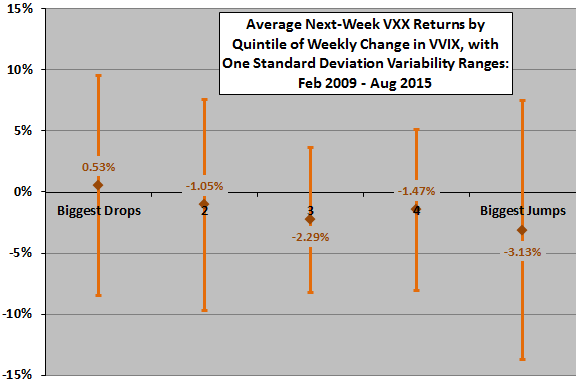
The next two charts summarize average next-week SPY (upper chart) and VXX (lower chart) returns and return variabilities by quintile of weekly change in VVIX. Again, there are 87-88 (65-66) observations per quintile for SPY (VXX).
Confirming the correlation analyses, these charts also do not show systematic progressions in returns across deciles. Tail effects include:
- Low (high) next-week average return for SPY after large weekly drops (jumps) in VVIX.
- High (low) average return for VXX after large weekly drops (jumps) in VVIX.
Are observed SPY tail effects exploitable?
To gauge exploitability of SPY tail effects, we test three simple market timing strategies, as follows:
- Starting at the beginning of 2008, calculate the inception-to-date averages and standard deviations of past levels of VVIX and past weekly changes in VVIX.
- When:
- The level of VVIX is greater than one standard deviation above its lagged mean (Level Signal), hold SPY through the next week. Otherwise, hold cash.
- The weekly change in VVIX is greater than one standard deviation above its lagged mean (Change Signal), hold SPY through the next week. Otherwise, hold cash.
- Both the level of VVIX and the weekly change in VVIX are greater than one standard deviation above their respective lagged means (Dual Signal), hold SPY through the next week. Otherwise, hold cash.
- Assume for all three cases, it is possible to anticipate signals by a few minutes and trade SPY at the same close used for signaling.
- Return on cash is the yield on 13-week U.S. Treasury bills.
- One-way SPY-cash switching friction is 0.1%.
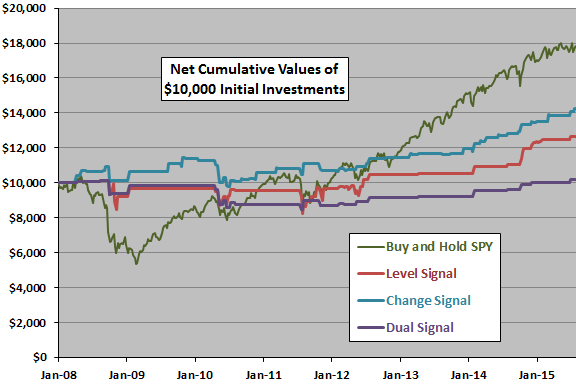
The final chart compares net cumulative values of $10,000 initial investments for buying and holding SPY and for the three VVIX-based SPY timing strategies. The timing strategies exhibit relatively low volatility and downside risk, but they ultimately underperform buying and holding SPY. Simple net annualized statistics are:
- Buy and Hold SPY: compound annual growth rate (CAGR) 8.2% and Sharpe ratio 0.50. However, this benchmark strategy suffers a large drawdown in 2008-2009.
- Level Signal: CAGR 3.3% and Sharpe ratio 0.33
- Change Signal: CAGR 4.9% and Sharpe ratio 0.66.
- Dual Signal: CAGR 0.2% and Sharpe ratio 0.00.
The start date of the test is unlucky for the buy-and-hold benchmark.
The correlation of weekly returns between the buy-and-hold benchmark and the Change Signal strategy is 0.39, suggesting a potential diversification benefit.
In summary, evidence from available data offers little support for belief that VVIX is useful for timing the U.S. stock market.
Cautions regarding findings include:
- As noted, sample periods (especially for VXX) encompass limited variety in market environments.
- Other VVIX-based signal constructions, applied either to SPY or VXX, may produce stronger market timing strategies.
- Applying multiple tests to the same set of data introduces data snooping bias, such that the best-performing strategy likely overstates expectations.
See “Volatility of Volatility as Stock Market Return Predictor” for analysis of realized volatility of volatility.