The Mojena Market Timing strategy (Mojena), developed and maintained by professor Richard Mojena, is a method for timing the broad U.S. stock market based on a combination of many monetary, fundamental, technical and sentiment indicators to predict changes in intermediate-term and long-term market trends. He adjusts the model annually to incorporate new data. Professor Mojena offers a hypothetical backtest of the timing model since 1970 and a live investing test since 1990 based on the S&P 500 Index (with dividends). To test the robustness of the strategy’s performance, we consider a sample period commencing with inception of SPDR S&P 500 (SPY) as a liquid, low-cost proxy for the S&P 500 Index. As benchmarks, we consider both buying and holding SPY (Buy-and-Hold) and trading SPY with crash protection based on the 10-month simple moving average of the S&P 500 Index (SMA10). Using the trade dates from the Mojena Market Timing live test, daily dividend-adjusted closes for SPY and daily yields for 13-week Treasury bills (T-bills) from the end of January 1993 through August 2018 (over 25 years), we find that:
Analyses assume the following:
- Initial investment size is $10,000.
- Use of dividend-adjusted values of SPY implies reinvestment of dividends.
- For Mojena, trade between SPY and cash at the close on the first trading day after the dates (Sundays) specified. Trading at the open is a feasible alternative.
- For SMA10, hold SPY (cash) when the S&P 500 Index is above (below) its SMA10 at the end of the prior month. There is slight anticipation of signals to trade at the same monthly close.
- Return on cash is the T-bill yield.
- One-way switching frictions are 0.1% of the balance for all switches (but zero for reinvestment of dividends).
- Ignore tax implications of trading.
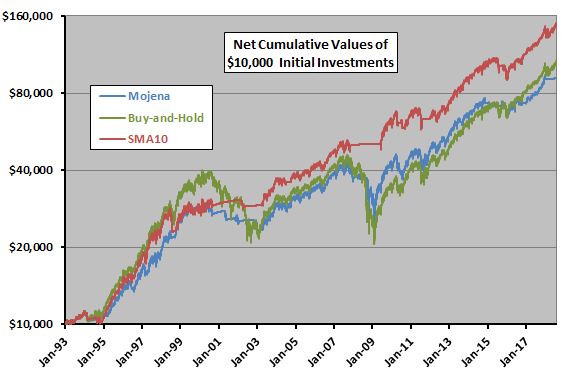
The following chart compares on a logarithmic scale net cumulative values of $10,000 initial investments for Mojena, Buy-and-Hold and SMA10 over the full sample period. Mojena largely tracks Buy-and-Hold. SMA10 mostly outperforms both. Quantitatively:
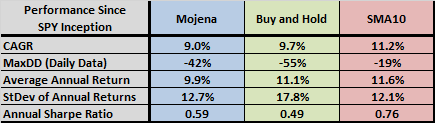
- Net compound annual growth rates (CAGR) for Mojena, Buy-and-Hold and SMA10 are 9.0%, 9.7% and 11.2%, respectively.
- Maximum drawdowns (MaxDD) based on daily data are -42%, -55% and -19%, respectively.
- Mojena generates 47 switches, compared to 25 for SMA10, so the former is more sensitive to the assumption about switching frictions.
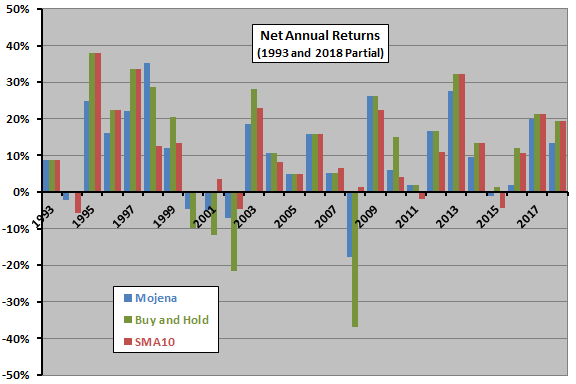
For another perspective, we look at returns by calendar year.
The next chart compares net calendar year returns for Mojena, Buy-and-Hold and SMA10 during 1993 (partial) through 2018 (partial). Average net annual returns through 2017 are 9.9%, 11.1% and 11.6%, respectively, with standard deviations 12.7%, 17.8% and 12.1%. Using the average daily T-bill yield during a year as the risk-free rate for that year, net annual Sharpe ratios are 0.59, 0.49 and 0.76, respectively.
Mojena beats Buy-and-Hold (SMA10) for five (eight) of 24 years. Mojena’s best year relative to Buy-and-Hold is 2008.
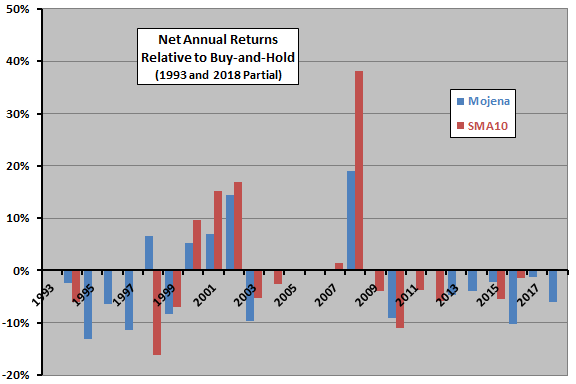
For additional insight, we compare performances of Mojena and SMA10 relative to Buy-and-Hold.
The final chart compares Mojena and SMA10 annual returns minus those of SPY. The chart shows that both timing strategies tend to outperform Buy-and-Hold during equity bear markets and underperform during bull markets. Their overall performances therefore depend on the mix of bull and bear states in the sample. Neither timing strategy has beaten Buy-and-Hold since 2008.
The following table summarizes performance statistics mentioned above.
In summary, evidence from simple tests over a 25+-year sample period suggests that Mojena Market Timing modestly outperforms buy-and-hold on a risk-adjusted basis, but substantially underperforms a simple and widely used technical bear market avoidance strategy.
Cautions regarding findings include:
- The sample period is not long in terms of number of bull and bear markets.
- As noted, Mojena outperforms Buy-and-Hold during only five of 24 calendar years, most strongly by avoidance of part of the market loss in 2008.