Is there a practical way to apply momentum investing in a Modern Portfolio Theory (MPT) framework? In his June 2014 paper entitled “Momentum, Markowitz, and Smart Beta”, Wouter Keller constructs a long-only, unleveraged Modern Asset Allocation (MAA) model in three steps
- Make MPT tactical by using short historical intervals to predict future asset returns (rate of return, or absolute momentum), return volatilities (based on daily returns) and return correlations (based on daily returns), assuming that measured behaviors will materially persist the next month. Assign zero weight to assets with negative returns over the historical measurement interval.
- Simplify correlation calculations by relating daily historical returns for each asset to those for a single market return (the average return of all assets weighted equally) rather than to returns for all other assets separately.
- Dampen errors in rapidly changing asset return, volatility and correlation predictions by “shrinking” them toward their respective averages across all assets in the universe, and dampen the predicted market volatility by “shrinking” it toward zero.
He reforms the MAA portfolio monthly at the first close. His baseline historical interval for estimation of all variables is four months (84 trading days). His baseline shrinkage factor for all variables is 50%. His principal benchmark is the equally weighted (EW) “market” of all assets, rebalanced monthly. He assumes one-way trading friction of 0.1%. He considers a range of portfolio performance metrics: annualized return, annual volatility, maximum drawdown, turnover, Sharpe ratio, Omega ratio and Calmar ratio. Using daily dividend-adjusted prices for assets allocated to three universes (10 exchange-traded funds [ETF], 35 ETFs and 104 U.S. stocks/bonds) during December 1997 through December 2013, he finds that:
- The MAA model devolves into other commonly used allocation models as follows:
- Making predicted returns equal for all assets produces a Minimum Variance (MV) version of MAA.
- Setting predicted return for each asset equal to its volatility produces a Maximum Diversification (MD) version of MAA.
- Ignoring market volatility in the MD version of MAA produces a naive Risk Parity (RP) version.
- Assuming that predicted returns, volatilities and market correlations are the same for all assets produces an Equal Weight (EW) allocation.
- For the simplest test universe of 10 ETFs:
- Full MAA easily outperforms its MV, MD and RP versions, as well as EW, across most performance measures.
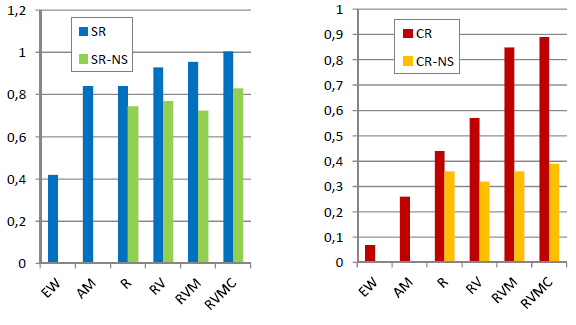
- Based on Sharpe ratio, the most important contributor to MAA performance is exclusion of assets with negative past returns (see the left-hand chart below).
- Based on Calmar Ratio, all components of MAA except predicted correlation make important contributions to MAA performance (see the right-hand chart below).
- Shrinking parameter estimates is generally important to MAA performance, and 50% shrinkage is near optimal for most parameters.
- The historical measurement interval of four months is optimal for the full sample period, but optimality is not stable over subperiods.
- MAA outperformance concentrates during the 2008-2009 financial crisis.
- For the larger ETF test universe, results are generally similar, though MAA outperformance is less concentrated in a short interval and EW fares perhaps somewhat better.
- For the universe of 100 U.S. stocks and four U.S. Treasury bond ETFs, MAA outperformance is even less concentrated over time, and the MD version of MAA performs nearly as well as MAA.
The following chart, constructed from data in the paper, summarizes the effect on net Sharpe ratio (SR) and net Calmar ratio (CR) of building the MAA model component-by-component over the available sample period for the simplest 10-asset universe, with 50% shrinkage of model parameters and without any shrinkage (NS). All component predictions are from asset return data over the past four months, with monthly portfolio reformation and 0.1% one-way trading friction. The build-up involves the following six portfolios:
- EW – all assets equally weighted, as a benchmark.
- AM – the equally weighted combination of assets with positive past returns (positive absolute momentum).
- R – assets with positive past returns weighted by shrunken or non-shrunken past returns.
- RV – R plus incorporation of shrunken or non-shrunken past asset volatilities.
- RVM – RV plus incorporation of shrunken or non-shrunken past market volatility.
- RVMC – RVM plus incorporation of shrunken or non-shrunken past asset return correlations with the market.
Results for SR suggest that excluding assets with negative absolute momentum and predicting future asset volatilities with shrunken past volatilities offer the largest benefits. Results for CR suggest that all model components except correlation add substantial value. The very unusual financial crisis of 2008-2009 has greater effect on CR than SR.
In summary, evidence from a 16-year sample indicates that a simplified, long-only, momentum-linked MPT applied to funds with parameters (1) estimated from recent data and (2) then shrunken toward averages for the selected universe of assets beats an equal-weight benchmark.
Cautions regarding findings include:
- As noted, sensitivity tests for the small ETF universe show that the default settings for the historical interval (four months) and shrinkage factor (50%) are near optimal, and this optimality materially drives MAA performance. To the extent that optimality derives from randomness, as suggested by instability of the optimal historical interval in a subperiod, results for these settings overstate expected MAA performance.
- As noted, much of the outperformance of MAA for the small ETF universe concentrates during the rare 2008 synchronized crashes across asset classes. Such an event may not recur.
- The assumed level of trading friction may be unrealistically low for some investors, especially for larger asset universes.
- Calculations involve considerable data collection/processing (or fees if delegated).
- Extending ETF histories backward using indexes as described may overstate returns since indexes include no costs for creating and maintaining liquid funds.
See also “Tactical, Simplified, Long-only MPT with Momentum” for an earlier presentation of MAA.