Is there some better predictor of long-term stock market return than the widely cited cyclically adjusted price-earnings ratio (P/E10 or CAPE)? In the July 2014 version of his paper entitled “Forecasting Equity Returns: An Analysis of Macro vs. Micro Earnings and an Introduction of a Composite Valuation Model”, Stephen Jones compares how well several fundamental and economic factors predict real long-term (10-year) equity market total return, with focus on Market Value/Gross Domestic Product (MV/GDP). He compares the predictive power of MV/GDP to those of P/E10 and Tobin’s q. He then constructs a multi-variable forecasting model that includes MV/GDP, a demographic metric and personal income-related variables. Using U.S. data since 1954 for different input variables, he finds that:
- MV/GDP is theoretically and, over the available sample period, empirically better than P/E10 for predicting in-sample real long-term equity market return.
- Valuation methods for individual firms do not make economic sense when aggregated across all firms.
- A linear relationship between MV/GDP (P/E10) and real 10-year future stock market return has an in-sample R-squared statistic of 0.52 (0.38), meaning that MV/GDP (P/E10) explains 52% (38%) of the variation in future return.
- The number of years used in P/E10 is arbitrary. Increasing the number of years (X) in P/EX increases its in-sample effectiveness towards that of MV/GDP.
- Unlike GDP, the denominator of P/E10 ratio does not distinguish between sustainable and unsustainable aggregate earnings. Aggregate earnings/GDP has generally risen over the sample period, driven by unsustainable increases in government and personal debt. For example, this ratio has an annual average of 17.5% over the past decade, 13.6% during the 1990s, 13.2% over the 1980s, 12.9% over the 1970s, 12.1% over the 1960s and 10.9% over the 1950s.
- Constructing a composite model of real 10-year stock market return involves:
- Combining MV/GDP with a demographic variable related to investment and consumption (optimally the ratio of the age 55-64 population to the age 35-44 population) to produce an in-sample adjusted R-squared of 0.86.
- Adding to this combination two economic growth potential indicators, personal income/book value and change in personal consumption/personal income, to boost predictive power further.
- Finally adding historical GDP growth as a predictive variable to create a composite model with an in-sample adjusted R-squared of 0.91, compared to 0.52 for MV/GDP alone, 0.49 for Tobin’s q alone and 0.38 for P/E10 alone.
- Out-of-sample tests since December 1972 confirm that MV/GDP is the best individual predictor of real 10-year equity market return and that the composite model is far superior to any individual predictor.
- Based on data as of 7/3/2014 (S&P 500 Index at 1985), with the assumption that dividends offset inflation, the composite model projects an annualized real return of -10.5% over the next decade and an index near 650 in 2024.
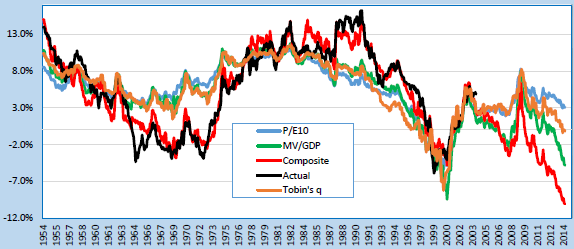
The following chart, taken from the paper, compares the S&P 500 Index actual annualized real 10-year total return (Actual) to the in-sample forecasts generated by P/E10, MV/GDP and Tobin’s q individually and by the composite model described above. The composite model clearly has the lowest in-sample tracking error. The average annualized real 10-year total return projected by the composite model ranges from -10.2% to 15.1%, with average 4.5%. The current projection (as of early July 2014) is the most bearish ever.
In summary, evidence from a U.S. stock market valuation model that encompasses sustainable growth, demographics and consumer potential indicates that the market is extremely overvalued as of July 2014.
Cautions regarding findings include:
- Even though comprised of many years, samples are short relative to a ten-year return measurement interval and a 12-year demographic cohort measurement interval.
- As noted, much of the analysis is in-sample, with associated look-ahead bias.
- Applying different models to the same data in search of the best one incorporates a form of snooping bias (luck), such that the historical accuracy of the best model likely overstates its expected predictive power. Snooping bias can be large when applied to effectively small samples.
- Snooping of the optimal demographic cohorts incorporates additional bias.
- Statistics do not correct for overlap of annual measurement of multi-year variables, which tends to inflate correlation.
- Historical economic data may not be completely stable due to retroactive revisions (as-released data may be different from curated historical series).