“Mutual Fund Hot Hand Performance” tests a “hot hand” strategy that each year picks the top performer from the Vanguard family of diversified equity mutual funds (not including sector funds) and holds that winner the next year. A subscriber suggested a robustness test using the Fidelity family of diversified equity mutual funds. To support the test, we select all Fidelity diversified U.S. and international equity mutual funds that bear no transaction fee, are open to new investors and have a history of at least three years. We consider the total return on the S&P 500 Index (with dividends estimated from Robert Shiller’s data) and SPDR S&P 500 (SPY) as benchmarks. As in the prior analysis of Vanguard funds, we pick end of June to end of the next June for annual return measurement intervals. To simplify analysis, we assume the “hot hand” mutual fund on the next-to-last trading day of June is the same as that for the end of June. We assume that there are no costs or holding period constraints/delay for switching from one fund to another. Using annual returns for the S&P 500 Index plus Shiller’s dividend data and annual returns for SPY and Fidelity diversified equity mutual funds as available from Yahoo!Finance during June 1980 through June 2014, we find that:
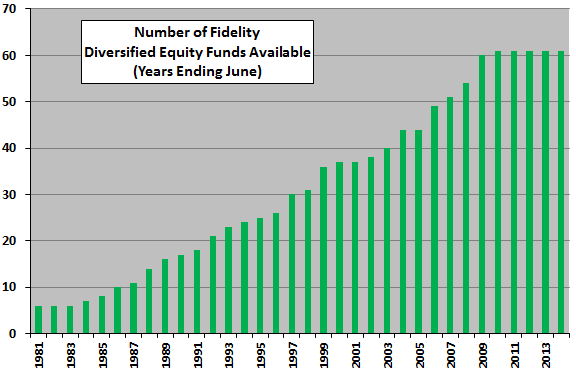
The following chart summarizes the number of Fidelity diversified equity mutual funds for annual return calculations as specified above available over the sample period, ranging from an initial 6 to a final 61. Some are passive (index) funds, and others are active. The “hot hand” fund for each June to June year comes from this growing universe.
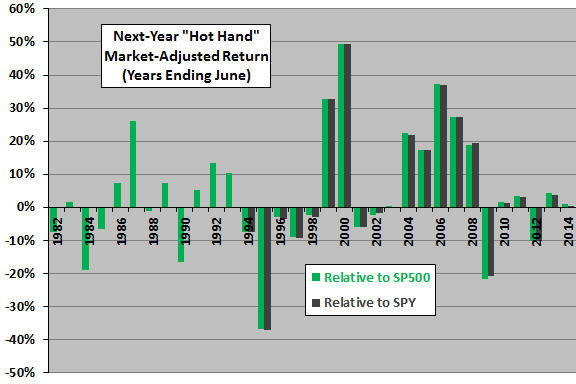
How does the next-year performance of the “hot hand” fund compare to performances of the S&P 500 Index and SPY benchmarks?
The next chart summarizes the next-year performance of the “hot hand” fund relative to the S&P 500 Index total return and SPY over respective sample periods:
During June 1982 through June 2014, the “hot hand” fund (S&P 500 Index) has an average annual return of 16.7% (12.5%), with standard deviation of annual returns 26.7% (17.7%) and worst year -47.2% (-25.4%) in 2009. The “hot hand” fund beats the S&P 500 Index in 19 of 33 years (58%).
During June 1993 through June 2014, the “hot hand” fund (SPY) has an average annual return of 15.7% (10.0%), with standard deviation of annual returns 28.1% (17.5%) and worst year -47.2% (-26.2%) again in 2009. The “hot hand” fund beats SPY in 11 of 21 years (52%).
The “hot hand” does not persistently outperform the U.S. stock market on an annual basis, with several bad streaks. For the last six years (June 2008 through June 2014), the “hot hand” underperforms SPY by an average 3.7% per year.
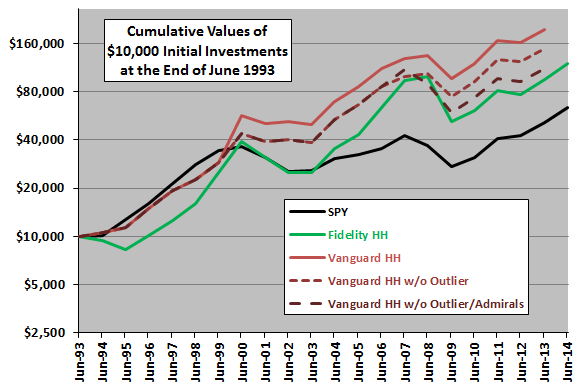
For another perspective, we look at cumulative performance.
The final chart compares on a logarithmic scale the cumulative values of $10,000 initial investments at the end of June 1993 in the following alternative strategies:
- Buy and hold SPY.
- Hold the Fidelity diversified equity mutual fund “hot hand” (Fidelity HH).
- Hold the Vanguard diversified equity mutual fund HH from “Mutual Fund Hot Hand Performance” (Vanguard HH).
- Hold Vanguard HH but substitute the second place fund for 2000 to avoid one extreme outlier return of 98.4% (Vanguard HH w/o Outlier).
- Hold Vanguard HH but avoid the 2000 outlier and exclude from consideration the “Admiral Shares” funds, which “are a separate share class of Vanguard mutual funds that were created to pass along the savings that result from larger accounts to the investors who own them” (Vanguard HH w/o Outlier/Admirals).
Performances for the last three strategies are through June 2013 only.
Results indicate that the Fidelity family does not work as well as the Vanguard family for executing the “hot hand” strategy. Also, results suggest that an investor experiencing the mid-1990s would not rationally have initiated a “hot hand” strategy.
In summary, evidence from this robustness test mostly weakens belief that a relative momentum strategy applied to a broad family of diversified equity mutual funds outperforms the U.S. stock market.
Cautions regarding findings include:
- Given the variability of returns and the apparent importance of having a large set of mutual funds in competition, samples are not long for this kind of analysis.
- The S&P 500 Index and SPY are arguably not the most appropriate benchmark for the “hot hand” strategy, which includes international funds. Some highly diversified global equity total return fund or random selection of a fund would be more representative of the specified mutual fund family.
- Real-time costs/restrictions for switching among Fidelity mutual funds over the sample period may differ from current rules.
- It is possible that Fidelity funds that would have affected annual selections disappear over sample period.
- As noted, the analysis above assumes that annual mutual fund winners are identifiable one day in advance.