What is the state of cyclically adjusted price-earnings ratios (CAPE, P/E10 or Shiller PE), stock index level divided by average real earnings over the past ten years, across country equity markets worldwide? In their July 2014 paper entitled “CAPE around the World: Update 2014 – The Relationship between Risk and Return”, Joachim Klement and Oliver Dettmann update expected returns for equity markets around the world in local currencies based on P/E10. They adjust P/E10 for economic conditions for each country via regression of P/E10 versus real GDP growth, real per capita GDP growth, real interest rate and inflation. Using stock index level, P/E10 and economic data for 20 developed and 18 emerging equity markets as available through June 2014, they find that:
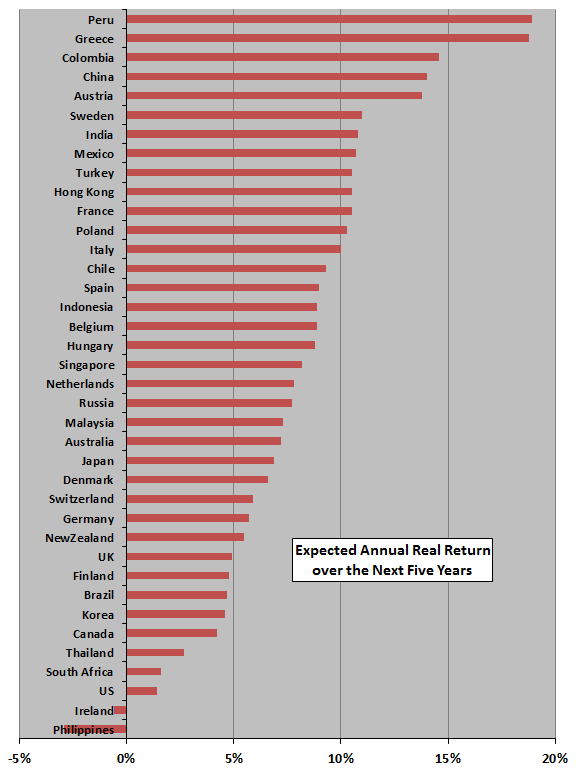
- Expected real returns for developed markets in local currencies are at or above historical averages (mid to high single digits) for the next five years, except for the U.S. and Ireland. Specifically (see the chart below):
- Based on capitalization (equal) weights, the average developed market expected annual real return is 7.5% (9.5%).
- European equity markets (particularly France, Italy and Spain) are exceptionally attractive.
- The U.S. equity market is one of the most overvalued in the world, with an expected average annual real return of 1.4%.
- Expected returns for emerging markets in local currencies are somewhat below those for developed markets. Specifically:
- Based on capitalization (equal) weights, the average emerging market expected annual real return is 6.6% (7.7%).
- The most developed emerging markets (Korea and Thailand) have low expected returns.
- Investors in markets with the lowest expected returns (Philippines, Ireland, U.S., Thailand, Korea) face the highest drawdown risk. France, Belgium, Hong Kong, Japan, Turkey, Poland and Peru combine attractive expected returns and low drawdown risks.
The following chart, constructed from data in the paper, ranks country equity markets by expected average annual real return in local currency over the next five years based on economically adjusted P/E10. Confidence level varies by country according to the available sample duration.
In summary, evidence from available data suggests economically adjusted P/E10 levels that are particularly attractive in Europe, but not the U.S.
Cautions regarding findings include:
- Sample periods are very short for many countries relative to 10-year earnings measurement intervals as inputs, and for five-year return measurement intervals as outputs.
- Currency exchange rate movements may offset country returns for a global investor.
- See “Predictive Power of P/E10 Worldwide” for additional background on methodology and associated cautions.
See “Implications of Worldwide P/E10s” for the 2013 iteration of this research series.