What is the best way to harvest asset mispricings derived from aggregate overreaction/underreaction by naive investors? In his July 2014 presentation package entitled “Betting On ‘Dumb Volatility’ with ‘Smart Beta'”, Claude Erb examines strategies for exploiting the “dumb volatility” arguably generated by naive investors who buy high and sell low, temporarily driving prices materially above and below fair values. These strategies generally involve periodically rebalancing portfolios to equal weights or some version of fair value weights (smart beta). Using monthly returns for a variety of indexes and funds during December 2004 through June 2014 (since the advent of smart beta research), he finds that:
- In aggregate, retail investors appear to underperform buy-and-hold by 2% or more per year.
- The amount of dumb volatility within a set of assets determines the potential dumb volatility return. During December 2004 through June 2014, the multi-factor alphas among ten alternative dumb volatility capture strategies range as high as 4% per year (see the chart below).
- However, some dumb volatility capture strategies (those relying substantially on small stocks, such as equal weight) have lower investment capacities and higher trading frictions than others.
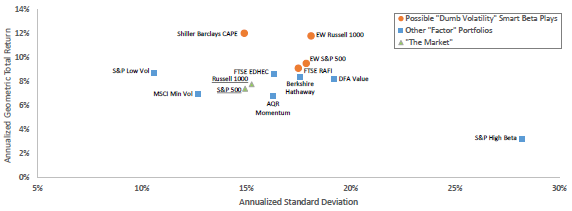
The following chart, taken from the presentation package, plots gross annualized return versus annualized standard deviation of returns for four smart beta/equal weight equity strategies, six equity factor strategies and two proxies for the U.S. stock market (S&P 500 Index and Russell 1000 Index) over the period December 2004 through June 2014. The two strategies with the strongest returns are:
- The Russell 1000 Equal Weight Index (EW Russell 1000) each quarter assigns equal weights to the stocks in the Russell 1000 Index, consisting of about 1,000 of the largest U.S. stocks based on a combination of market capitalization and current index membership. Guggenheim Russell 1000 Equal Weight ETF (EWRI) attempts to track this index since December 2010.
- The Shiller Barclays CAPE U.S. Core Sector Index (Shiller Barclays CAPE) each month assigns equal weights to four of ten U.S. equity sectors that are undervalued based on Cyclically Adjusted Price-Earnings ratio (CAPE) and exhibit relatively strong price momentum over the past 12 months. Barclays ETN+ Shiller CAPE ETN (CAPE) attempts to track this index since October 2012.
These two indexes achieve gross annual multi-factor alphas of about 4% over the sample period. The associated exchange-traded funds and notes (ETFs and ETNs) have very short histories.
In summary, evidence suggests that some strategies usefully harvest dumb volatility generated by naive investors.
Cautions regarding findings include:
- The overall sample period is short for reliable estimation of annualized performance.
- Analyses use indexes, which do not account for rebalancing frictions and other costs incurred in maintaining liquid funds. These costs would lower reported returns, perhaps differently for some indexes than others, potentially affecting relative performance.
- ETFs and ETNs associated with these indexes typically have very short histories.
- Applying many strategies to the same or similar data sets introduces data snooping bias, such that the best-performing strategy incorporates luck likely to disappear in future samples.