Can individual investors reliably extract excess returns from long-only stock momentum? In their April 2014 paper entitled “Profitable Momentum Trading Strategies for Individual Investors”, Bryan Foltice and Thomas Langer examine whether a long-only stock momentum portfolio holding the top one to 50 stocks outperforms the stock market on a net basis. Their approach avoids issues of shorting costs/feasibility and explores trade-offs between gross performance and trading frictions. Their baseline analysis: (1) ranks stocks based on six-month total return; (2) forms an equally weighted portfolio of the top 1, 2, 3, 4, 5, 6, 7, 8, 9, 10, 15, 20, 30, 40 and 50 stocks at the next close; (3) holds the portfolio for 12 months; and, (4) estimates net returns nine initial investment amounts ranging from $5,000 to $1,000,000. They approximate one-way trading friction a $10 commission plus a half bid-ask spread specified by range of market capitalization (0.21% to 0.75%) plus a relatively small SEC fee. For stocks retained from the prior portfolio, the bid-ask spread applies only to the change in position size from rebalancing to equal weight. Finally, they investigate whether employing overlapping portfolios of small numbers of stocks (forming portfolios more frequently than annually but still holding each portfolio for a year) suppresses volatility and improves risk-adjusted performance. They use buy-and-hold the S&P 500 Total Return Index as a benchmark. Using data for live and dead NYSE stocks with contemporaneous market capitalizations over $20 million during 1991 through 2010 (an average of 2,201 stocks per month), they find that:
- Regarding average gross monthly return for baseline momentum portfolios:
- All scenarios outperform the S&P 500 Total Return Index (by 0.64% to 2.45% per month).
- Smaller, purer portfolios generally perform best, but the top 1 portfolio surprisingly performs worst. The top 7 portfolio is optimal.
- Momentum performance is somewhat weaker during the second of two equal subperiods. The momentum strategy crashes during 2007-2008.
- Regarding average net monthly for baseline momentum portfolios with initial investments ranging from $5,000 to $1,000,000:
- Almost all scenarios outperform the S&P 500 Total Return Index.
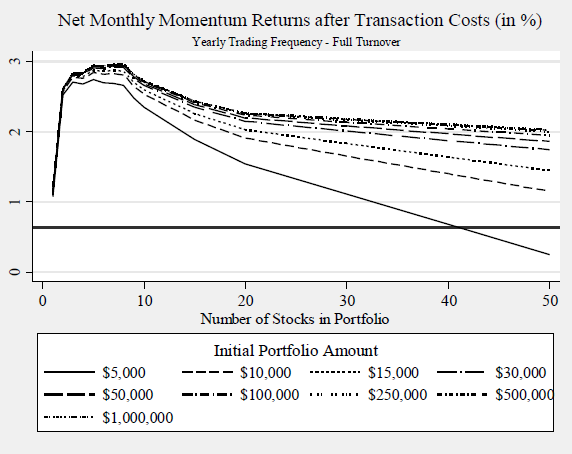
- Optimal portfolio sizes are 3-8 stocks for a $5,000 initial investment and 5-8 stocks for all other initial investment amounts (see the chart below). These optimal portfolios outperform the S&P 500 Index by more than 2% per month.
- Average net three-factor (market, size, book-to-market) alphas for optimal portfolio sizes are in the range 1.5% to 1.8%.
- Regarding net performance of overlapping portfolios formed at frequencies from monthly to semi-annually (still with a 12-month holding interval) for small numbers of stocks:
- Increasing portfolio formation frequency initially increases the risk-adjusted performance (Sharpe ratio) of these portfolios up to an optimal point when trading frictions begin to dominate.
- Holding overlapping portfolios of the top 5-8 stocks formed monthly to semi-annually generates larger risk-adjusted returns than holding one portfolio of the top 20-50 stocks formed annually. Each initial investment amount has a different optimal overlapping momentum portfolio formation frequency.
The following chart, taken from the paper, plots net monthly returns for many momentum strategy scenarios depending on number of stocks in the portfolio (one to 50) and initial investment amount ($5,000 to $1,000,000).
Portfolio formation/holding and trading friction accounting rules are as described in the introductory paragraph above. The thick horizontal line is average S&P 500 Total Return Index monthly return of 0.63%.
Results indicate that a momentum strategy applied to U.S. stocks may be attractive for individual investors with optimal portfolio breadth in the range of 5-8 stocks.
In summary, evidence indicates that individual investors may be able to exploit U.S. stock momentum with portfolios of just five to eight stocks selected based on six-month past return and held for 12 months, perhaps most effectively by holding several such overlapping portfolios.
Cautions regarding findings include:
- Individuals may not have been able to acquire necessary data in a timely manner at no cost during all of the sample period.
- Testing many different strategy variations and parameter settings on the same set of data introduces substantial data snooping bias, such that the best performing scenarios likely overstate expected performance.
- As noted, the strategy crashes during 2007-2008.
- The capitalization-weighted S&P 500 Total Return Index may not be the most appropriate benchmark. A broad, equal-weighted fund, such as Guggenheim S&P 500 Equal Weight ETF (RSP) would be a better fit, but none may be available over the entire sample period.
- A visualization of cumulative performances of different strategy variations would be helpful.
- It would be interesting to know how the strategy variations perform since 2010.