What is the best estimate of the Equity Risk Premium (ERP), the return in excess of the risk-free rate required as compensation for the risk of holding equity? In his August 2014 paper entitled “A History of the Equity Risk Premium and its Estimation”, Basil Copeland summarizes recent ERP estimates and explains how the historical equity return can overstate ERP in terms of unanticipated (anomalous) capital gains. He further describes the behavior of historical and expected ERP during 1872 through 2013 and estimates ERP for 2014 through 2023. He discusses ERP estimation issues such as geometric mean versus arithmetic mean and top-down versus bottom-up forecasts. Using data from Shiller for 1871-1959 and from Damodaran for 1960-2013, he finds that:
- Over the full 1872-2013 sample period, the historical geometric mean ERP is 4.14%. Adjusting for anomalous capital gains derived from changes in dividend yield (earnings yield) produces an expected ERP of 3.50% (3.80%).
- During late the 19th and early 20th century, expected ERP trends slowly upward in the range 2%-3%. The upward trend accelerates in the mid-1920s, peaking at nearly 5% around the end of World War II. Expected ERP then declines until about 1988.
- Anomalous (unlikely to repeat) capital gains during the 20th century make the historical ERP overstate expected ERP.
- The typical 2% spread between ERPs based on geometric and arithmetic means comes from inappropriate use of historical return volatility rather than volatility of expected ERP.
- Bottom-up earnings forecasts are generally too optimistic, resulting in substantial overstatement of expected ERP.
- ERP estimates from surveys of academics are generally much too high, perhaps framed by historical risk premiums extant when they were graduate students.
The following chart, taken from the paper summarizes a representative sampling of expected ERP estimates based on both arithmetic (A) and geometric (G) means. Arithmetic (geometric) estimates relate to contemporaneous the U.S. Treasury bill (U.S. Treasury note/bond) yield.
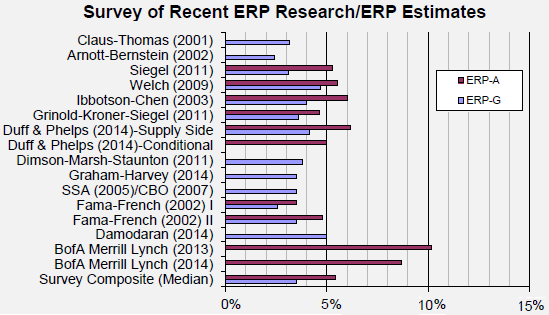
In summary, evidence indicates that expected future ERP is in the upper half of the 3%-4% range based on both geometric and arithmetic means.
Cautions regarding findings include:
- Anomalous contributions to the historical ERP can be substantial.
- Statistical interpretations assume that stock market and U.S. Treasuries have tame return distributions (no dominating crashes).
- ERP estimates do not consider the costs of capturing the premium (trading frictions).