Is the capitalization-weighted market portfolio a lame benchmark? In his August 2014 paper entitled “It’s Easy to Beat the Market”, Moshe Levy tests the perception that it is hard to beat a capitalization-weighted portfolio and therefore that an index so weighted is a challenging benchmark. Specifically, he compares the gross risk-adjusted performance of a capitalization-weighted buy-and-hold portfolio to those of 1,000 random-weighted (normalized to 100%) buy-and-hold portfolios of the same stocks.To ensure liquidity, he restricts the portfolios to the 500 U.S. stocks with the largest market capitalizations at the beginning of 1998. If a stock is delisted during the sample period due to merger/acquisition or bankruptcy, he sets its weight to zero at that point and renormalizes residual portfolios to 100% [per an email exchange with the author]. He focuses on Sharpe ratio and terminal value of an initial investment as key performance metrics. He ignores trading frictions, arguing that no trading is involved other than initial purchases at portfolio formation and reinvestment of dividends. Using daily total (dividend-reinvested) returns for the specified stocks and the contemporaneous 30-day U.S. Treasury bill yield as the risk-free rate during January 1998 through December 2012, he finds that:
- The average gross monthly Sharpe ratio of the random-weighted portfolios is 0.067, compared to 0.059 for the capitalization-weighted portfolio.
- 93% of random-weighted portfolios generate higher Sharpe ratios than the capitalization-weighted portfolio (see the chart below).
- 93% of random-weighted portfolios generate higher terminal values than the capitalization-weighted portfolio.
- Capitalization-weighted portfolio underperformance derives from a size effect. The 40% of stocks with the largest capitalizations have materially lower average monthly returns than the smaller 60% of stocks.
- An equal-weighted, annually rebalanced portfolio generates a gross monthly Sharpe ratio of 0.082.
- A robustness test that randomly tweaks allocations in the capitalization-weighted portfolio shows that deviations from the market portfolio generally improve performance. In contrast, random deviations from an equal-weighted portfolio generally degrade performance.
- Across randomly selected five-year subperiods, random-weighted portfolios generate a higher average gross monthly Sharpe ratio (terminal value) than a capitalization-weighted portfolio 82% (87%) of the time.
- Findings hold after accounting for potential return distribution non-normalities.
- Gross results are stronger when applied to larger universes of stocks.
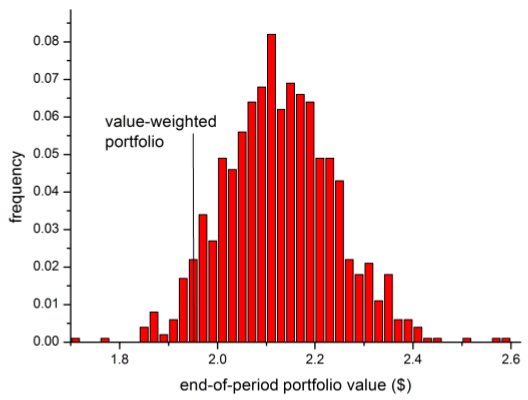
The following chart, taken from the paper, is a histogram of the gross terminal values at the end of 2012 of $1 initial investments in the 1,000 random-weighted buy-and-hold portfolios of the 500 U.S. stocks with the largest market capitalizations as of January 1, 1998. The market capitalization-weighted (value-weighted) portfolio produces a terminal value of $1.95. Terminal values for 93.1% of the random-weighted portfolio exceed this amount.
For reference, the terminal value of a $1.00 buy-and-hold position in SPDR S&P 500 (SPY) taken at the first open in January 1998, with dividends reinvested, grows to $1.90 by the end of 2012.
In summary, evidence from performance of random-weighted U.S. stock portfolios suggests that a capitalization-weighted portfolio is far from optimal, and an equal-weighted portfolio is near optimal.
Cautions regarding findings include:
- Investability is an important aspect of a benchmark, and investability differs for large and small investors. Some investors may want to consider Guggenheim S&P 500 Equal Weight ETF (RSP) as a “standard” equity benchmark rather than SPY. Over the available sample period (May 2003 through August 2014), a $1.00 initial investment in RSP (SPY), with dividends reinvested, grows to a gross $2.61 ($1.73).
- The author asserts that the only trading involved in the tests described comes from taking initial positions at portfolio formation and reinvesting dividends. However, portfolio renormalization after eliminating allocations to delisted stocks would require incremental purchases of all stocks remaining in the portfolio.