Is the difference between upside and downside asset participation ratios relative to a benchmark a useful metric for evaluating asset investment performance? In his June 2014 paper entitled “On the Holy Grail of ‘Upside Participation and Downside Protection'”, Edward Qian defines and investigates the performance implications of the Participation Ratio Difference (PRD) as a measure of combined upside participation and downside protection. He defines the upside (downside) participation ratio of an asset as the ratio of expected excess return for the asset to the expected excess return of its benchmark when benchmark returns are positive (negative). “Excess” means in excess of the return on cash (such that cash has zero participation rates). He defines PRD as the simple difference between positive participation ratio (P+) and negative participation ratio (P-). He then investigates the relationship between asset PRDs and one-factor (market) alphas. He then checks PRDs for the S&P 500 sectors (with the S&P 500 Index as the benchmark) and PRDs for Russell style indexes (with the Russell 3000 Index as the benchmark). Using monthly returns of the S&P 500 index and its ten sectors during October 1989 through April 2014 and monthly returns of Russell broad and value-growth style indexes during January 1979 through April 2014, he finds that:
- An asset’s PRD is approximately proportional to its market alpha. A positive/negative/zero PRD indicates a positive/negative/zero alpha.
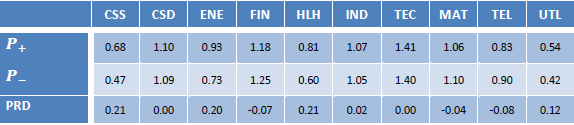
- With respect to S&P 500 sectors relative to the S&P 500 Index (see the first table below):
- There is an almost perfect relationship between S&P 500 sector PRDs and their respective performances relative to the S&P 500 Index.
- Defensive, low-beta (cyclical, high-beta) sectors tend to have positive (negative) PRDs.
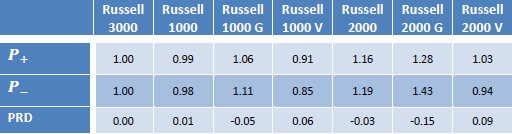
- With respect to Russell indexes relative to the Russell 3000 Index (see the second table below):
- The Russell 1000 Value Index and the Russell 2000 Value Index have slightly positive PRDs.
- The Russell 1000 Growth Index, the Russell 2000 Growth Index and the Russell 2000 Index have slightly negative PRDs.
- Regarding the threshold for an attractive PRD:
- The higher the Sharpe ratio of the benchmark index, the higher the PRD an investor should demand of an asset or strategy.
- The lower the beta of an asset or strategy, the higher the PRD an investor should demand of it.
- For example, for a benchmark index with Sharpe ratio 0.15 and an asset/strategy with beta 0.5, the PRD must be at least 0.19 to match or beat the benchmark.
- Results are arguably confirmation of the low-beta/low-volatility anomaly.
The following tables summarize participation ratios and PRDs of the ten S&P sector indexes relative to the S&P 500 Index (upper table) and the participation ratios for Russell indexes relative to the Russell 3000 Index (lower table). PRDs closely track one-factor alphas of the sector and style indexes relative to their respective benchmark indexes.
In summary, evidence indicates that the difference in upside and downside participation ratios of an asset or strategy relative to a benchmark index is a close proxy for the one-factor alpha of the asset or strategy relative to the benchmark.
Cautions regarding findings include:
- The study employs indexes rather than tradable assets. The costs of maintaining liquid funds that track these indexes may vary by sector and style, such that findings for tradable index proxies may differ from those for the indexes.
- The study does not test whether PRD is effective for picking assets that perform well out of sample.