Does the term structure of the the option-implied expected volatility of the S&P 500 Index (VIX, normally measured at a one-month horizon) predict future returns of variance assets such as variance swaps, VIX futures and S&P 500 Index option straddles? In his January 2015 paper entitled “Risk Premia and the VIX Term Structure”, Travis Johnson investigates the relationship between the VIX term structure slope and the variance risk premium as measured by future returns of such assets. He constructs the VIX term structure by each day calculating six values of VIX from prices of S&P 500 Index options with maturities of one, two, three, six, nine and 12 months. He measures the variance risk premium from daily returns of S&P 500 Index variance swaps, VIX futures and S&P 500 Index option straddles of various maturities. Using daily closing quotes for the specified S&P 500 index options and daily returns for the specified variance assets as available during 1996 through 2013, he finds that:
- The slope of the VIX term structure is on average positive (upward from left to right).
- The VIX term structure does not predict changes in VIX level.
- However, the VIX term structure slope predicts excess returns (relative to the risk-free rate) of S&P 500 Index variance swaps, VIX futures and S&P 500 Index option straddles for all maturities. A relatively low (high) slope predicts relatively high (low) returns.
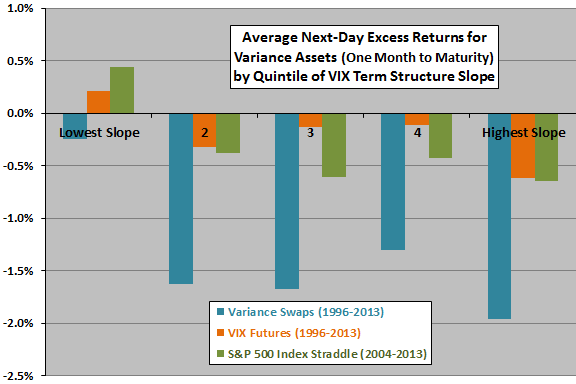
- The difference in average next-day returns between the fifths (quintiles) of days with the lowest and highest VIX term structure slopes ranges from 0.29% to 1.81% across 18 variance asset/maturity combinations (see the chart below for one-month maturity).
- When the VIX term structure slope is very low, average next-day returns become positive for 17 of these 18 combinations.
- The VIX term structure slope and implied minus expected S&P 500 Index variance are the strongest of variance risk premium predictors tested.
The following chart, constructed from data in the paper, summarizes average next-day excess returns for one-month S&P 500 Index variance swaps, one-month VIX futures and one-month S&P 500 Index option straddles as available during 1996 through 2013 across quintiles of the daily VIX term structure slope. When the VIX term structure slope is very low (very high), the term structure slopes downward (upward). Results indicate that returns generally, but not always, decrease as the VIX term structure slope increases.
In summary, evidence indicates that investors may be able to exploit information in the daily VIX term structure slope by taking positions in S&P 500 Index variance swaps, VIX futures (or derivative exchange-traded products) and S&P 500 Index option straddles.
Cautions regarding findings include:
- Timely generation of the VIX term structure may be problematic for many investors, or costly if delegated.
- Reported returns are gross, not net. Including trading frictions for variance assets would reduce these returns. These frictions may be high.
- Trading strategies based on daily VIX term structure signals may be very volatile.
- Some trades may not be directly accessible to some investors.
See also the somewhat related “Identifying VXX/XIV Tendencies” and “Exploiting VIX Futures Roll Return with ETNs”.