In reference to “Optimal Monthly Cycle for Simple Asset Class ETF Momentum Strategy?”, a subscriber asked about an optimal monthly cycle for the “Simple Debt Class Mutual Fund Momentum Strategy”. This latter strategy each month allocates the entire portfolio value to the one of the following 12 debt class mutual funds with the highest past total return (optimally over the last two months):
T. Rowe Price New Income (PRCIX)
Thrivent Income A (LUBIX)
Vanguard GNMA Securities (VFIIX)
T. Rowe Price High-Yield Bonds (PRHYX)
T. Rowe Price Tax-Free High Yield Bonds (PRFHX)
Vanguard Long-Term Treasury Bonds (VUSTX)
T. Rowe Price International Bonds (RPIBX)
Fidelity Convertible Securities (FCVSX)
PIMCO Short-Term A (PSHAX)
Fidelity New Markets Income (FNMIX)
Eaton Vance Government Obligations C (ECGOX)
Vanguard Long-Term Bond Index (VBLTX)
To investigate, we compare 21 variations of the strategy based on shifting the monthly return calculation cycle relative to trading days from the end of the month (EOM). For example, an EOM+5 cycle ranks funds based on closing prices five trading days after EOM each month. We use the historically optimal two-month fund momentum measurement interval. Using daily dividend-adjusted closes for the 12 funds during mid-December 1994 through mid-January 2015 (241 months), we find that:
Calculations derive from the following assumptions:
- Reallocate at the close on the specified trading day of each month (ignore the constraint that mutual fund prices are available only once a day after the close).
- Do not account for any unusual market closures (as in September 2001).
- There are no costs for switching between funds.
- Ignore any tax implications of trading.
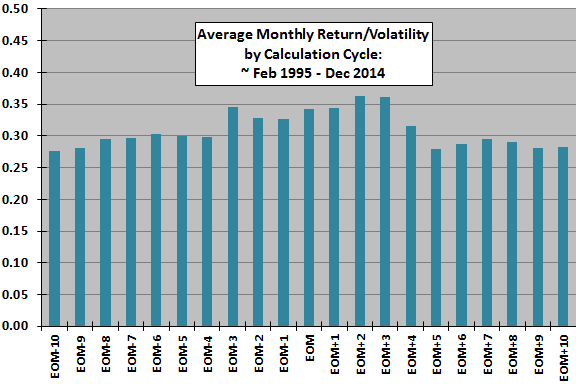
The following chart compares average monthly returns divided by volatilities (standard deviations) of monthly returns for all 21 monthly calculation cycles. Ratios range from 0.28 for several cycles to 0.36 for EOM+2 and EOM+3. The average (median) return-to-volatility ratio across all cycles is 0.31 (0.30). The ratio for the EOM cycle is 0.34.
While slight differences in start and stop dates explain some differences in results, results suggest some turn-of-the-month effect that makes cycles within three trading days of EOM more effective than other cycles. To the extent noise drives the variation in results, differences across cycles reflect data snooping. Daily market data is generally very noisy compared to longer-interval data.
For another perspective, we look at terminal values and maximum drawdowns across calculation cycles.
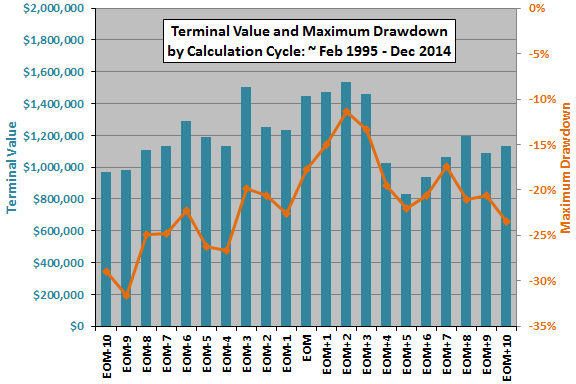
The next chart compares net terminal values of $100,000 initial investments and maximum (peak-to-trough) drawdowns for all 21 monthly calculation cycles.
Terminal values range from $829,609 for EOM+5 to $1,535,316 for EOM+2. The average (median) terminal value across all cycles is $1,190,516 ($1,132,474). The terminal value for the EOM cycle is $1,447,198. Again, slight differences in start and stop dates explain some differences in results. However, the observed differences are likely due to (unexploitable) noisy signals or to a persistent (exploitable) monthly cycle in investor behavior.
For greater depth of perspective, we compare cumulative trajectories.
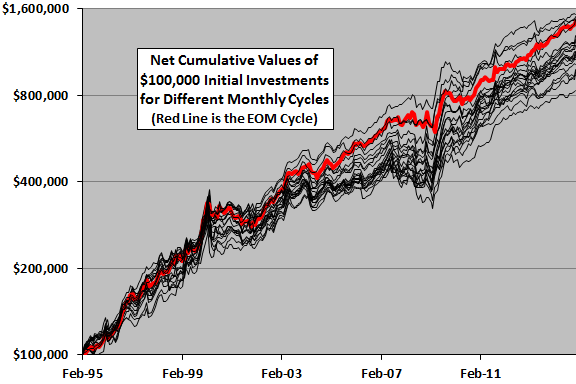
The final chart tracks on a logarithmic scale cumulative values of $100,000 initial investments for all 21 monthly calculation cycles over the available sample period. For this comparison, we align the slightly different start and stop dates. The heavy red line is the trajectory of the EOM cycle.
Again, slight differences in start and stop dates explain some differences in trajectories. However, the observed differences are likely due to (unexploitable) noisy signals or to a persistent (exploitable) monthly cycle in investor behavior.
Maximum drawdowns for the 21 cycles range from -11% for EOM+2 to -32% for EOM-9. The average (median) maximum drawdown across all cycles is -21% (-21%). The maximum drawdown for the EOM cycle is -18%.
In summary, evidence suggests that the optimal monthly calculation cycle for the Simple Debt Class Mutual Fund Momentum Strategy is within three trading days of the end of the month, with the end of the month near optimal.
To the extent that some persistent calendar effect drives differences in outcomes, an investor using the strategy may want to perform monthly calculations at EOM+2. To the extent that differences in outcomes derive from randomness, an investor using the strategy would most rationally expect the average or median outcome (while prepared for worst case).
Cautions regarding findings include:
- As noted, the two-month momentum ranking interval is historically optimal and likely incorporates monthly data snooping bias.
- As noted, brute force experimentation introduces data snooping bias. The performance of the best (worst) monthly calculation cycle tends to overstate (understate) expected performance of the strategy. Daily data is especially noisy and subject to snooping bias.
- Backtesting and tracking monthly adjusted return cycles other than that based on EOM is cumbersome.
- The sample is not long in terms of variety in interest rate environments (essentially one secular decline). Tightening by central banks and a secular rise in interest rates may disrupt the strategy. The equity-like aspects of convertible and high-yield bond funds somewhat mitigate this concern.
- As noted, it is not possible to generate signals and execute at the same close for mutual funds. A one-day delay in signal execution may affect results.
- Estimation of frictions from mutual fund loads and frequent trading penalties is problematic since fund policies may have changed over the sample period.