A subscriber inquired whether the “Simple Asset Class ETF Momentum Strategy” (SACEMS) is a good diversifier of the U.S. stock market. This strategy allocates funds at the end of each month to the one (Top 1), equally weighted two (EW Top 2) or equally weighted three (EW Top 3) of the following asset class exchange traded funds (ETF) or Cash with the highest total return over the past five months:
PowerShares DB Commodity Index Tracking (DBC)
iShares MSCI Emerging Markets Index (EEM)
iShares MSCI EAFE Index (EFA)
SPDR Gold Shares (GLD)
iShares Russell 1000 Index (IWB)
iShares Russell 2000 Index (IWM)
SPDR Dow Jones REIT (RWR)
iShares Barclays 20+ Year Treasury Bond (TLT)
3-month Treasury bills (Cash)
To investigate, we first look at correlations between momentum strategy returns and those of SPDR S&P 500 ETF (SPY) and Vanguard Balanced Index Investor Shares (VBINX), with the latter maintaining an approximately 60% allocation to the broad U.S. stock market and a 40% allocation to the U.S. corporate bond market. We then generate return statistics for portfolios that hold equally weighted combinations of: (1) the Top 1 momentum strategy and SPY, and (2) Top 1 and VBINX. Using monthly dividend-adjusted returns for the specified funds and the monthly Treasury bills yield as a proxy for Cash during January 2003 through January 2015, we find that:
During January 2003 through January 2015, the correlation of monthly returns between Top 1 and SPY (VBINX) is 0.29 (0.33). These correlations are not high, but nor are they indicative of perfect diversifiers. Over the subperiod since August 2006 (when the momentum strategy can use all ETFs), the correlation of monthly returns between Top 1 and SPY (VBINX ) is 0.22 (0.26), between EW Top 2 and SPY (VBINX) is 0.31 (0.34) and between EW Top 3 and SPY (VBINX) is 0.44 (0.47).
Further tests focus on Top 1 since it has the lowest correlations with SPY and VBINX.
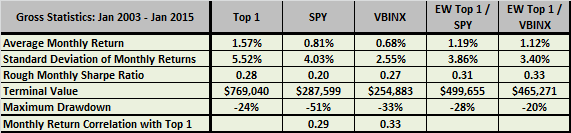
The following table summarizes gross performance statistics for Top 1, SPY and VBINX, plus two combination portfolios:
- EW Top 1 / SPY each month allocates half of funds to Top 1 and half to SPY.
- EW Top 1 / VBINX each month allocates half of funds to Top 1 and half to VBINX.
Both combinations boost rough Sharpe ratio (average monthly return divided by standard deviation of monthly returns) compared to components. The Sharpe ratio metric arguably penalizes Top 1 for upside volatility. Both combinations suppress maximum (peak-to-trough) drawdown compared to SPY and VBINX, but not compared to Top 1. Top 1 easily outperforms the combinations based on terminal value.
Applying a 0.25% trading friction per switch changes Top 1 average monthly return to 1.47%, terminal value to $664,432 and maximum drawdown to -25%. Applying strict monthly rebalancing frictions to EW Top 1 / SPY and EW Top 1 / VBINX would lower their performances materially.
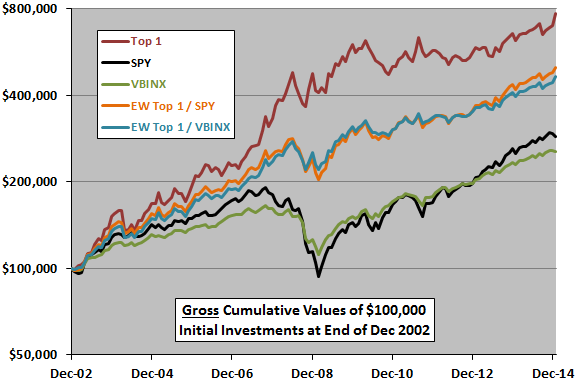
For another perspective, we look at cumulative performances.
The following chart compares on a logarithmic scale the trajectories of $100,000 investments at the end of December 2002 in each of the above five portfolios. Results show that the combination portfolios generate fairly steady gains except during the 2008 financial crisis.
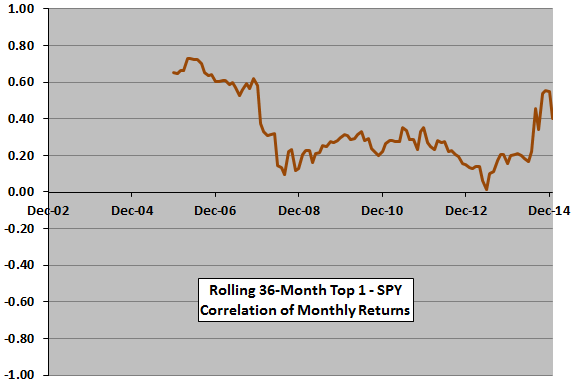
Are Top 1 diversification effects relative to SPY consistent over time?
The final chart tracks the rolling 36-month correlation of monthly returns between Top 1 and SPY over the available sample period. Results show that correlation varies considerably (highest when U.S. stocks are persistently the momentum winner, and generally lower after more ETFs are available to the momentum strategy), but is beneficial during the 2008 financial crisis.
It may be that the multi-asset class momentum strategy would more effectively and consistently diversify a multi-asset class value strategy (perhaps characterized as an income strategy). However, no such fund has a long enough history for useful testing.
In summary, evidence from available data suggest that the Simple Asset Class ETF Momentum Strategy offers some diversification benefits in combination with SPY or VBINX.
Cautions regarding findings include:
- Most of the above findings are gross, not net. As noted, including switching frictions for the momentum strategy and rebalancing frictions for the combination strategies would lower performance statistics and may affect findings.
- As noted, the momentum strategy may be a better diversifier of a strategy that picks from multiple asset classes based on value than it is for SPY and VBINX (see “Combining Value and Momentum Across Asset Classes” and “Combined Value-Momentum Tactical Asset Class Allocation”).