A subscriber hypothesized that combining short-term reversal with intermediate-term momentum would enhance momentum strategy performance. To investigate, we test a modification of the “Simple Asset Class ETF Momentum Strategy”, which each month allocates all funds at the end of each month to the one of the following asset class exchange-traded funds (ETF) or Cash with the highest total return over the past five months (Top 1):
PowerShares DB Commodity Index Tracking (DBC)
iShares MSCI Emerging Markets Index (EEM)
iShares MSCI EAFE Index (EFA)
SPDR Gold Shares (GLD)
iShares Russell 1000 Index (IWB)
iShares Russell 2000 Index (IWM)
SPDR Dow Jones REIT (RWR)
iShares Barclays 20+ Year Treasury Bond (TLT)
3-month Treasury bills (Cash)
The modification each month first identifies the top three ETFs or Cash based on past five-month returns and then picks the one of these three with the lowest return over the past five trading days (Top 3 Loser). This approach should pick intermediate-term winners that tend to benefit (or at least not suffer) from any reversal of short-term movements. Using daily and monthly dividend-adjusted closing prices for the asset class proxies and for SPDR S&P 500 (SPY) and the yield for Cash during February 2006 (when all ETFs are first available) through February 2015 (109 months), we find that:
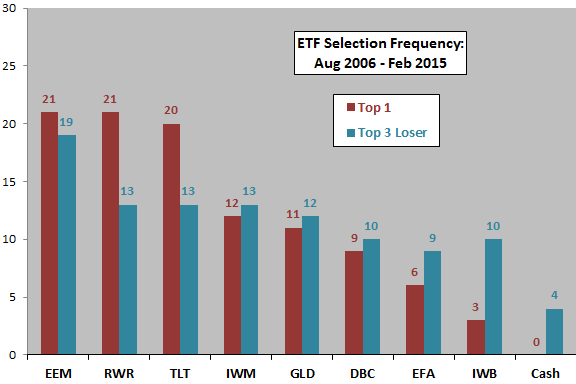
The following chart shows the distribution of asset class ETF selections for the Top 1 and Top 3 Loser strategies over the available sample period. The general effect of preferring relatively weak short-term performance is to shift emphasis from RWR and TLT to common stock funds, especially large-capitalization (low-volatility) stock funds.
How do the selected ETFs translate into cumulative performance?
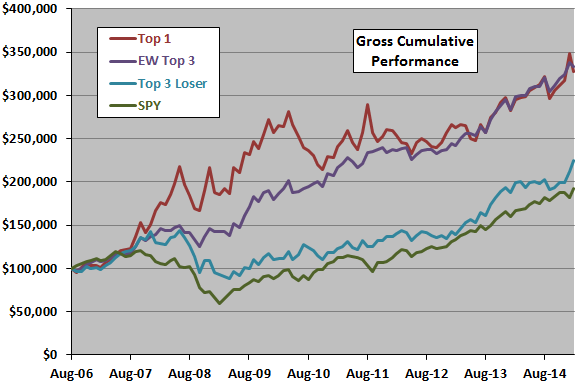
The next chart compares gross cumulative values of $100,000 initial investments in the Top 1 and Top 3 Loser strategies. For comparison, the chart also shows gross cumulative performance for an equally weighted Top 3 portfolio (EW Top 3) and for buying and holding SPY. Calculations derive from the following assumptions:
- Reallocate/rebalance at the close on the last trading day of each month (assume that total five-month and five-day past returns for the ETFs can be calculated just before the close).
- Ignore trading (switching) frictions for the active strategies.
- Ignore any tax implications of trading.
Top 3 Loser is not very successful, essentially because it fails to avoid the equity bear market of 2008-2009, during which it has a maximum (peak-to-trough) drawdown of -39%. For comparison, maximum drawdowns for Top 1, Top 3 and SPY are -25%-16% and -51%, respectively.
Likely due to injection of noise from short-term returns, Top 3 Loser trades about twice as often as Top 1 (79 versus 40 switches). Trading frictions would therefore put greater downward pressure on Top 3 Loser performance than on Top 1 performance. For example, imposing a two-way switching friction of 0.25% of the balance makes Top 3 Loser performance more similar to that of buying and holding SPY.
How do average monthly returns, as alternative measures of performance, compare?
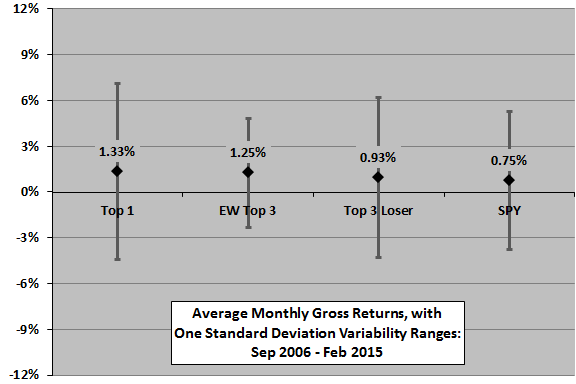
The final chart summarizes average monthly gross returns and standard deviations of monthly returns for Top 1, EW Top 3, Top 3 Loser and SPY over the available sample period. Rough gross monthly Sharpe ratios (average return divided by standard deviation) are 0.23, 0.35, 0.18 and 0.16, respectively.
Results emphasize the diversification benefit (volatility suppression) of holding all three top ETFs.
In summary, evidence from simple tests on a limited sample period does not support belief that adding a short-term reversal rule to the Simple Asset Class ETF Momentum strategy improves performance.
Cautions regarding findings include:
- Sample size is small (about 22 independent five-month momentum ranking intervals). Concentration of performance differences during the unusual environment of the financial crisis amplifies this concern.
- Some short-term measurement interval other than five trading days may be more effective in extracting value from any reversal effect. Brute force testing of other intervals would import data snooping bias, which tends to be large when working with noisy daily data.
Refer also in “Simple Sector ETF Momentum Strategy” to the performance of the 6-1;1 strategy variation, which seeks to avoid adverse short-term reversals by excluding the most recent month from the momentum ranking interval.