“Simple Asset Class ETF Value Strategy” (SACEVS) tests a simple relative value strategy that each quarter allocates funds to one or more of the following three asset class exchange-traded funds (ETF), plus cash, based on degree of undervaluation of measures of the term risk, credit risk and equity risk premiums:
3-month Treasury bills (Cash)
iShares 7-10 Year Treasury Bond (IEF)
iShares iBoxx $ Investment Grade Corporate Bond (LQD)
SPDR S&P 500 (SPY)
One version of SACEVS (Best Value) picks the most undervalued premium. Another (Weighted) weights all undervalued premiums according to degree of undervaluation. Premium calculations and SACEVS portfolio allocations are quarterly per the arrival rate of new corporate earnings information. The principal benchmark is a quarterly rebalanced portfolio of 60% SPY and 40% IEF. A subscriber asked whether monthly SACEVS updates outperform quarterly updates. Using monthly S&P 500 Index levels, quarterly S&P 500 earnings and monthly average yields for 3-month Constant Maturity U.S. Treasury bills (T-bills), 10-year Constant Maturity U.S. Treasury notes (T-notes) and Moody’s Seasoned Baa Corporate Bonds during March 1989 through March 2015 (limited by availability of earnings data), and monthly dividend-adjusted closing prices for the above three asset class ETFs during September 2002 through March 2015 (154 months, limited by availability of IEF and LQD), we find that:
We measure the three risk premiums as follows:
- The term risk premium for a month is the difference in average daily yields between T-notes and T-bills during that month.
- The credit risk premium for a month is the difference in average daily yields between Moody’s Baa bonds and T-notes during that month. This definition assumes investors hold corporate bonds as a risky alternative to U.S. Treasuries of comparable duration.
- The equity risk premium for a month is the difference between the S&P 500 Index actual operating earnings yield at the end of month based on the most recent 12-months earnings data (three to five months old, depending on month of the quarter, to ensure availability of earnings data) and the average daily T-note yield during that month. This definition assumes investors hold stocks over an extended period (10 years) as a risky alternative to U.S. Treasuries.
Premium valuation and portfolio allocation calculations are the same as in “Simple Asset Class ETF Value Strategy”.
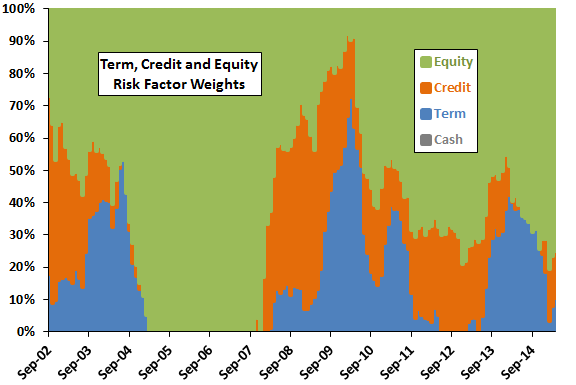
The following chart summarizes monthly weights assigned to risk premiums over the available sample period. Results are very close to those generated with quarterly data. Over the available sample period, the average monthly weights for equity, credit, term and cash are 63%, 19%, 18% and 0%, respectively.
How do these weights translate into cumulative performance?
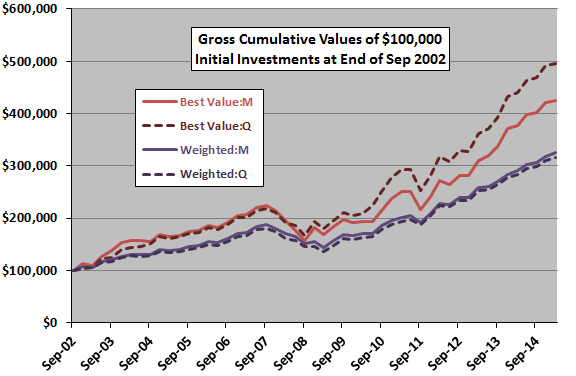
The next chart compares gross cumulative values of $100,000 initial investments in the two SACEVS risk premium valuation strategies run at either monthly or quarterly frequencies over the available sample period. We compound monthly returns to a quarterly frequency for comparison. Calculations derive from the following assumptions:
- Reallocate/rebalance at the close on the last trading day of each month or quarter (assume that average yields for the bills and bonds can be accurately estimated just before the close).
- Ignore trading frictions for making position changes.
- Ignore any tax implications of trading.
The Best Value strategy run monthly (Best Value:M) underperforms the Best Value strategy run quarterly (Best Value:Q), with respective gross compound annual growth rates (CAGR) 12.3% and 13.7%. Quarterly returns differ between Best Value:M and Best Value:Q for only nine of 50 quarters. Best Value:M switches ETFs twice as often as Best Value:Q (12 versus 6 times), to the advantage of Best Value:Q. Maximum (peak-to-trough) drawdown measured at a quarterly frequency is -30% for Best Value:M and -24% for Best value:Q.
The Weighted strategy run monthly (Weighted:M) slightly outperforms the Weighted strategy run quarterly (Weighted:Q), with respective gross CAGRs 9.9% and 9.6%. Maximum drawdowns measured at a quarterly frequency are -23% for Weighted:M and -25% for Weighted:Q.
The 60%-40% SPY-IEF benchmark (not shown) performs slightly worse for monthly rebalancing than quarterly rebalancing, with respective gross CAGRs 8.4% and 8.6%.
The sample period is short for these kinds of comparisons.
In summary, evidence from a limited sample period generally does not support belief that running SACEVS at a monthly frequency is better than running it at a quarterly frequency.
Cautions regarding findings include:
- As noted, sample size is modest (only about 13 years of ETF data). Also as noted, outperformance of Best Value:Q compared to Best Value:M comes from only nine of 50 quarters and therefore may be sensitive to variations in methodology.
- As noted, calculations above ignore fund switching frictions. Frictions are lowest for the Best Value:Q strategy.
- Other cautions noted in “Simple Asset Class ETF Value Strategy” apply.