Commodity futures embed spot price expectations, and investors in futures seek a premium for bearing the risk that these expectations are wrong. Is the behavior of the risk premium for commodity futures over the last decade consistent with prior research? In their May 2015 paper entitled “Facts and Fantasies About Commodity Futures Ten Years Later”, Geetesh Bhardwaj, Gary Gorton and Geert Rouwenhorst update a study of commodity futures returns based on an equally‐weighted index of 36 contract series spanning energy, metals, grains and oilseeds, animal products and agricultural softs with ten years of additional data. They assume positions are fully collateralized (by equal positions in U.S. Treasury bills) and rebalanced monthly. They focus on differences between findings from the prior study and findings for the last ten years. Using monthly total returns for the specified equally-weighted commodity futures index, the S&P 500 index and a long-term U.S. Treasury bonds index during July 1959 through December 2014, they find that:
- During 2005 through 2014, the average annual commodity futures index risk premium is 3.67%, less than the average 5.23% (but about the same as the median) for 1959 through 2004. The low average return over the last decade is due largely to low collateral returns (low U.S. Treasury bill yields).
- Over the entire sample period, gross annualized Sharpe ratios for commodity futures, stock and bond indexes are 0.43, 0.38 and 0.26, respectively (see the chart below). Over the last decade, Sharpe ratios are 0.24, 0.48 and 0.56, with all three markets exhibiting an increase in volatility.
- In general, using annual rather than monthly rebalancing increases gross performance of the futures index but decreases performance of matched spot positions. These findings are consistent with momentum in futures returns and reversion in spot prices.
- A strategy that is each month long (short) the half of commodities with the highest (lowest) roll yields, a measure of the difference between spot prices and futures prices, generates a gross annualized return of about 10% during both the original sample period and the last decade. Returns to this strategy are positive for 59% of months in both samples.
- Correlations between the commodity futures index and inflation are generally positive over all sample periods and measurement intervals, suggesting that commodity futures are an inflation hedge. Correlations are somewhat higher during the last (low-inflation) decade.
- Correlations between commodity futures index returns and equity returns are mostly negative at different measurement intervals during 1959 through 2004, but positive and above 0.5 during 2005 through 2014. However, within the last decade, the correlation spikes strongly during 2009‐2011 and then falls close to zero.
- The correlation between commodity futures returns and bond returns is comparatively stable (slightly to somewhat negative).
- Correlations between most commodity categories and the equal-weighted index are higher during the last decade than earlier. The average pairwise correlation among commodities spikes in 2008 and reverses since. A reasonable interpretation is that intra‐commodity correlations relate strongly to the business cycle.
The following chart, taken from the paper, compares inflation‐adjusted performances of the equally‐weighted commodity futures index, the S&P 500 Total Return Index (stocks) and a long-term U.S. Treasury bond index (bonds) over the entire sample period. Darker shading indicates the last decade. Over the entire sample period, annualized returns in excess of U.S. Treasury bill yields are 5.23% for commodity futures, 5.65% for stocks and 2.22% for bonds.
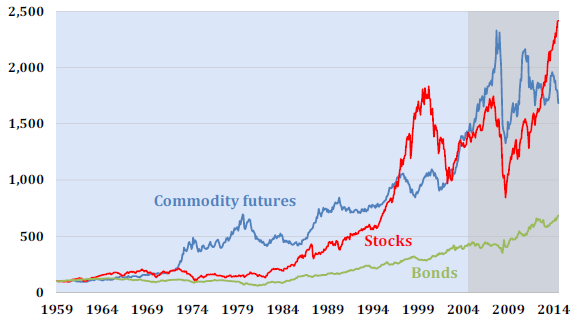
In summary, evidence indicates that an equally weighted commodity futures index offers a long-term return comparable to that of U.S. stocks, and usually offers good diversification of U.S. stocks and U.S. Treasury bonds.
Also, commodity spot returns are not good proxies for commodity futures returns.
Cautions regarding findings include:
- Reported performances are gross, not net. Costs of monthly rebalancing of commodity futures positions and of maintaining tradable proxies of stock and bond indexes would lower returns.
- A value-weighted stock index may not be the most appropriate comparable for an equal-weighted commodity futures index.
- As noted in the paper, the gross returns to spot commodities do not account for any costs of holding physical inventories. These costs may be considerable.
For a summary of the original study, see “Classic Paper: Empirical Overview of Commodity Futures”.