“Simple Asset Class ETF Value Strategy” (SACEVS) tests a simple relative value strategy that each quarter allocates funds to one or more of the following three asset class exchange-traded funds (ETF), plus cash, based on degree of undervaluation of measures of the term risk, credit risk and equity risk premiums:
3-month Treasury bills (Cash)
iShares 7-10 Year Treasury Bond (IEF)
iShares iBoxx $ Investment Grade Corporate Bond (LQD)
SPDR S&P 500 (SPY)
One version of SACEVS (Best Value) picks the most undervalued premium. Another (Weighted) weights all undervalued premiums according to degree of undervaluation. Premium calculations and SACEVS portfolio allocations derive from quarterly average yields for 3-month Constant Maturity U.S. Treasury bills (T-bills), 10-year Constant Maturity U.S. Treasury notes (T-notes) and Moody’s Seasoned Baa Corporate Bonds (Baa). A subscriber asked whether fresh end-of-quarter yields might work better than quarterly average yields. Using monthly S&P 500 Index levels, quarterly S&P 500 earnings and daily T-note, T-bill and Baa yields during March 1989 through March 2015 (limited by availability of earnings data), and quarterly dividend-adjusted closing prices for the above three asset class ETFs during September 2002 through March 2015 (154 months, limited by availability of IEF and LQD), we find that:
Premium valuation and portfolio allocation calculation methods are essentially the same as in “Simple Asset Class ETF Value Strategy”. However, in addition to the original SACEVS strategy, we consider two modifications:
- SACEVS:EOQ substitutes end-of-quarter T-bill, T-note and Baa yields for quarterly average yields.
- SACEVS:EOQ-1 substitutes one-day-before-end-of-quarter T-bill, T-note and Baa yields for quarterly average yields, in case timely availability of end-of-quarter data is problematic.
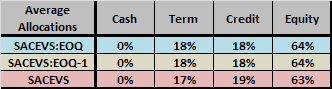
The following table summarizes average quarterly weights assigned to risk premiums during September 2002 through March 2015 for SACEVS and the two modifications. Results are very similar.
How do allocated weights translate into cumulative performance?
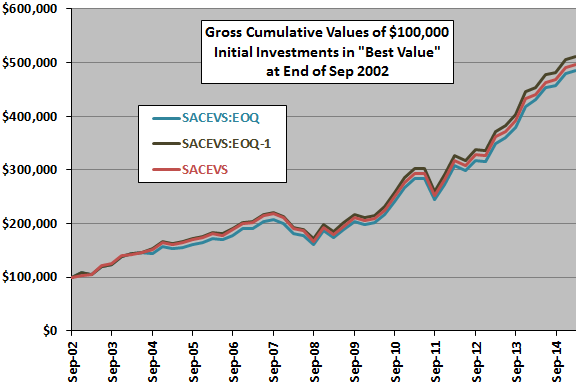
The next chart compares gross cumulative values of $100,000 initial investments in the Best Value versions of SACEVS, SACEVS:EOQ and SACEVS:EOQ-1 over the available sample period. Calculations derive from the following assumptions:
- Reallocate/rebalance at the close on the last trading day of each quarter.
- Ignore trading frictions for making position changes.
- Ignore any tax implications of trading.
Based on terminal values, SACEVS:EOQ-1 very slightly outperforms SACEVS, and SACEVS:EOQ very slightly underperforms SACEVS. Since the staler EOQ-1 data performs better, noise is a likely cause of differences.
Especially since Best Value involves few fund switches, the sample period is short for this comparison.
For perspective, we look at some statistics for the Best Value versions.
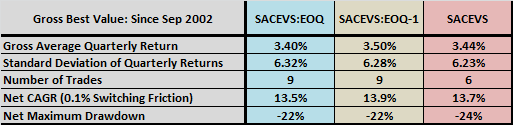
The following table summarizes some performance statistics for the Best Value versions of the three alternative strategies over the available sample period. Results suggest that:
- The original SACEVS is slightly less volatile than the modifications.
- SACEVS:EOQ and SACEVS:EOQ-1 switch funds more often than SACEVS, so there are potential friction/tax differences.
- The modified strategies have slightly lower maximum drawdowns.
Given the small numbers of fund switches, these differences are unlikely to be reliable.
What about Weighted versions of the three strategies?
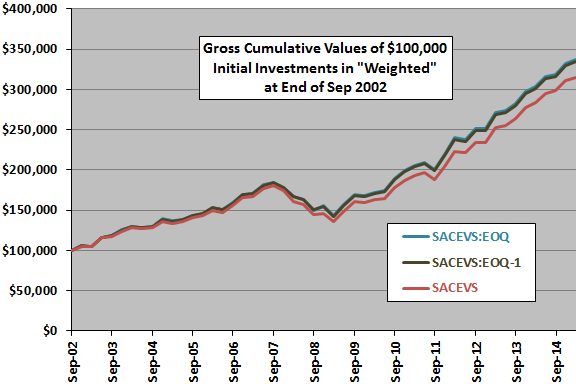
The next chart compares gross cumulative values of $100,000 initial investments in the Weighted versions of the three alternative strategies over the available sample period. Based on gross terminal values, SACEVS:EOQ and SACEVS:EOQ-1 modestly outperform the original SACEVS.
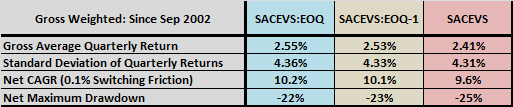
For perspective, we look at some statistics for the Weighted versions.
The following table summarizes some performance statistics for the Weighted versions of the three alternative strategies over the available sample period. As found for Best Value, the Weighted version of the original SACEVS exhibits slightly lower volatility but slightly higher maximum drawdown compared to the modifications.
The average magnitude of quarterly shifts in weights (not shown in the table) is somewhat larger for SACEVS:EOQ and SACEVS:EOQ-1 than for SACEVS, so friction/tax considerations tend to offset performance deficits for SACEVS.
In summary, evidence from a limited sample period offers a little (but not completely consistent) support for belief that running SACEVS with end-of-quarter yield data beats running it with quarterly average yield data.
It is plausible that SACEVS is not very sensitive to such modifications because value metrics tend to revert slowly.
Cautions regarding findings include:
- As noted, sample size is modest (only about 13 years of ETF data), especially for Best Value due to the small number of fund switches.
- As noted, performance calculations above ignore fund switching frictions and tax implications of switching. Frictions are lowest for the original SACEVS, so there is some tradeoff between gross performance and frictions/taxes.
- Other cautions noted in “Simple Asset Class ETF Value Strategy” apply.