Which is better, sector-based or factor-based stock investing? In their June 2015 paper entitled “Factor-Based v. Industry-Based Asset Allocation: The Contest”, Marie Briere and Ariane Szafarz compare the attractiveness of sector-based and factor-based U.S. stock allocations. From Kenneth French’s data library, they extract return series for 10 sectors and five factors (size, value, profitability, investment and momentum). They expand the factor set to 10 by using long and short portfolios for each factor. They consider three trials:
- Which group, sectors or factors, yields the dominantly more attractive efficient frontier?
- Which group offers the clearly superior gross Jensen’s alphas across single-sector/factor portfolios and portfolios diversified across sectors or factors based on maximizing estimated Sharpe ratio, minimizing estimated volatility or equal weighting?
- Do portfolios diversified across sectors or factors (based on maximizing estimated Sharpe ratio, minimizing estimated volatility or equal weighting) offer the best gross Sharpe ratios?
For each trial, they test long-only and long-short factor portfolios. Also for each trial, they test the overall sample, economic recession and expansion subsamples (per the National Bureau of Economic Research) and bull and bear market subsamples (per Forbes magazine). Using monthly U.S. stock market factor and sector returns from Kenneth French’s library spanning July 1963 through November 2014, they find that:
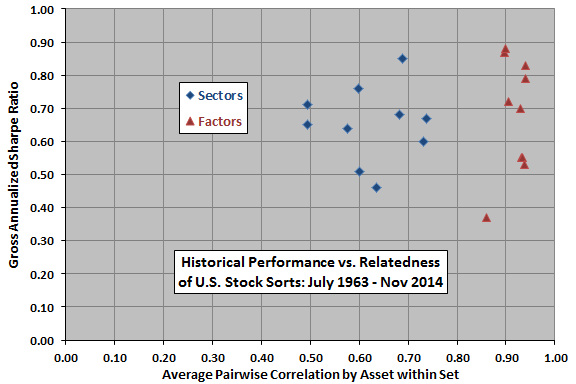
- Over the entire sample period, sectors and factors exhibit similar performance ranges but different levels of intra-group relatedness (see the chart below). Specifically:
- Ranges of gross annualized Sharpe ratios are similar for sectors (0.51 for technology to 0.85 for non-durables) and factors (0.37 for short low-momentum to 0.88 for long high-momentum).
- However, over the entire sample period, the overall average pairwise correlation within sectors (0.62) is substantially lower than that within factors (0.92), indicating greater potential for diversification benefit in the former.
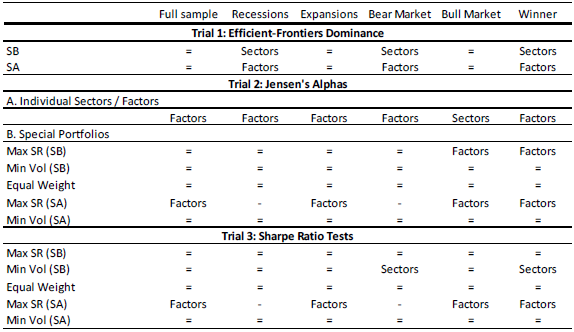
- The most frequent outcome of sector versus factor contests is a draw (see the table below). However:
- For contests that are not a draw, factor investing consistently outperforms sector investing when short sales are allowed.
- For a long-only investment policy, sector investing is preferable during recessions and bear markets.
The following chart, constructed from data in the paper, relates gross annualized Sharpe ratio to intra-group average pairwise correlation of monthly returns by asset over the entire sample period. Results suggest that, as defined:
- Sectors and factors have about the same range of performance.
- Sectors are generally less related to other sectors than factors are to other factors. In other words, sectors offer greater diversification potential than factors.
This visualization shifts somewhat according to economic (recession versus expansion) and financial market (bull versus bear) conditions.
The following table, taken from the paper, summarizes sector versus factor gross outcomes across all tests. In this table, SB (SA) means Shorting Banned (Allowed) for multi-factor portfolios. Results show that sectors and factors usually perform similarly, but factors win most other contests.
In summary, evidence from an array of tests indicates that U.S. stock factor investing and U.S. stock sector investing often generate similar gross outcomes, but factors mostly beat sectors on a gross basis when outcomes differ and shorting is allowed.
Cautions regarding findings include:
- As noted in the paper, the portfolios tested are ideal, ignoring frictions involved in periodic portfolio formation and shorting. These costs are likely higher for factor portfolios than sector portfolios, with stocks migrating across factor boundaries much more often than companies changing industries. Moreover, shorting may not be feasible for all underlying stocks. Net findings would likely improve the relative performance of sector investing.
- Other ways of defining sector and factor portfolios may produce different findings. For example, more restrictive sector definitions and more extreme factor portfolios may boost performance and lower intra-group relatedness.
- The study addresses U.S. stocks only.