What are current implications of cyclically adjusted price-earnings ratios (CAPE, P/E10 or Shiller PE), stock index level divided by average real earnings over the past ten years, across country equity markets worldwide? In his July 2015 paper entitled “CAPE around the World: Update 2015 – Return Differences and Exchange Rate Movements”, Joachim Klement analyzes expected returns in local currencies for equity markets around the world based on an adjusted P/E10. His adjustment accounts for economic conditions in each country via regression of local P/E10 versus real GDP growth, real per capita GDP growth, real interest rate and inflation. He also examines interactions among exchange rate movements, adjusted P/E10s and expected returns. Using stock index level, P/E10, economic data and exchange rate versus the U.S. dollar for 20 developed and 18 emerging equity markets as available through June 2015, he finds that:
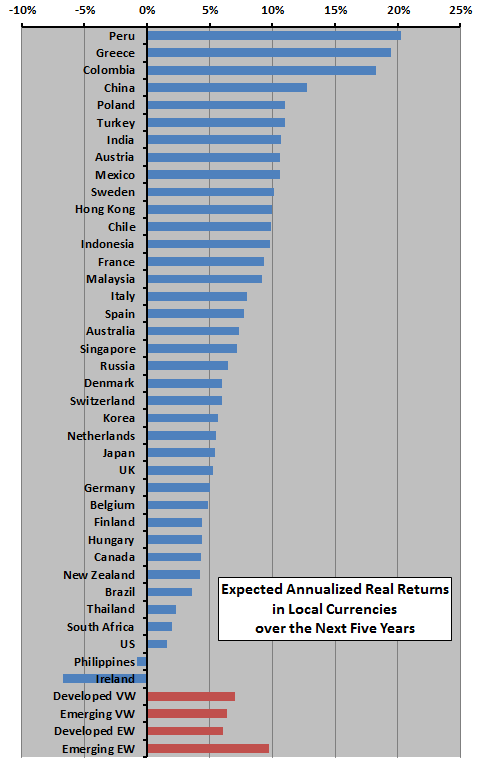
- For developed markets (see the chart below):
- Based on capitalization (equal) weights, the average expected annualized real return in local currencies is 7.0% (6.1%).
- Austria, Sweden, Hong Kong and France have the highest expected real returns.
- The U.S. market has one of the lowest expected real returns (1.6%).
- For emerging markets:
- Based on capitalization (equal) weights, the average expected annualized real return in local currencies is 6.4% (9.7%).
- Peru, Greece and Columbia have the highest expected returns.
- A relatively high (low) adjusted P/E10 suggests the associated currency will appreciate (depreciate) over the next five years. For example, current adjusted P/E10 differences between the U.S. stock market and those of Germany, France and Italy suggest that the euro will fall 10% to 40% versus the dollar over the next five years. Dollar appreciation may offset weak U.S. stock market performance.
The following chart, constructed from data in the paper, ranks country equity markets by expected annualized real return in local currencies over the next five years based on economically adjusted P/E10. Confidence level varies by country according to the available sample duration.
In summary, evidence from available data suggests economically adjusted P/E10 levels that predict attractive local returns in some developed and emerging markets (not in the U.S.), but currency exchange movements may offset differences in expected returns.
Cautions regarding findings include:
- Sample periods are very short for many countries relative to 10-year earnings measurement intervals as inputs and five-year return measurement intervals as outputs.
- See “Predictive Power of P/E10 Worldwide” for additional background on methodology and associated cautions.
See “Implications of Worldwide P/E10s” and “P/E10s Worldwide in 2014” for previous iterations of this research series.