Does combining the outputs of many methods of estimating the equity risk premium (ERP) produce a useful result? In their February 2015 paper entitled “The Equity Risk Premium: A Review of Models”, Fernando Duarte and Carlo Rosa estimate ERP via principal component analysis of 20 models, which they assign to five categories: (1) predictors based solely on historical average return; (2) dividend discount analyses; (3) regressions that extract expected market return from the behaviors of individual stocks; (4) regressions that relate stock market performance to economic variables over time; and, (5) surveys of experts. Principal component analysis derives the linear combination of model outputs that explains as much of the variance in outputs as possible. The authors follow common practice in using the S&P 500 Index as a stock market proxy and nominal or real U.S. Treasury yields as risk-free rates. Using monthly model inputs during January 1960 to June 2013, they find that:
- The simple average of ERP estimates across all models over the entire sample period is 5.7%, with average standard deviation 3.2%.
- Models within a category tend to give similar ERP estimates, with dividend discount and survey models generally low and models that extract ERP estimates from individual stock behaviors generally high.
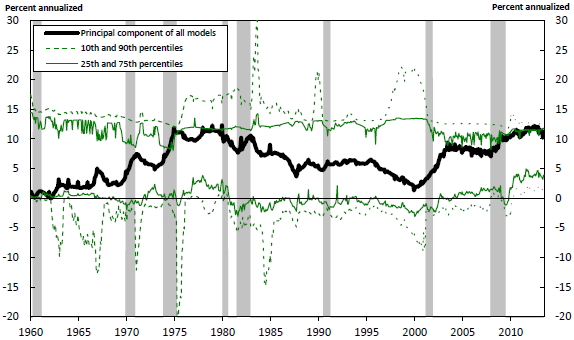
- Recent ERP estimates are around 12%, higher than the 10.5% observed in early 2009 and close to those observed in the 1970s (see the chart below).
- Low U.S. Treasury yields drive the recently elevated ERP. Conventional price-dividend and price-earnings ratios tend not to be good guides in such an environment.
- ERP estimates have considerable uncertainty, but the standard deviation of estimates across models shrinks from 10.2% in January 2000 to 4.3% in June of 2013.
The following chart, taken from the paper, tracks the principal component ERP estimate across all 20 models, with NBER economic contractions shaded. This combination estimate tends to peak during financial turmoil, economic contractions and times of slow real GDP growth or high inflation. It tends to bottom after sustained bull markets and high real GDP growth.
The chart also tracks the ERP estimates of the next to top/bottom estimates (10th and 90th percentiles) and the fifth from the top/bottom estimates (25th and 75th percentiles) to illustrate the degree of dispersion in model outputs.
In summary, evidence based on principal component analysis of 20 models suggests that an historically very low risk-free rate has recently driven the equity risk premium to very high levels.
Cautions regarding findings include:
- The methodology is beyond the reach of many investors.
- As noted by the authors, ERP estimates are very uncertain.
- Also as noted by the authors, most of the models are recent, potentially introducing look-ahead bias. Moreover, they may be survivors of many unsuccessful (and unpublished) models, thereby bearing publication bias.
- The study is not up to date.