“Mark Hulbert’s NASDAQ Newsletter Sentiment Index” reviews the usefulness of the Hulbert Stock Newsletter Sentiment Index (HSNSI), which “reflects the average recommended stock market exposure among a subset of short-term market timers tracked by the Hulbert Financial Digest.” Mark Hulbert presents HSNSI as a contrarian signal for future stock returns; when HSNSI is high (low), he views the outlook for stocks as materially bearish (bullish). In recent years, he has shifted emphasis in his MarketWatch columns from HSNSI to the Hulbert Nasdaq Newsletter Sentiment Index (HNNSI), stating that: “Since the Nasdaq responds especially quickly to changes in investor mood, and because those timers are themselves quick to shift their recommended exposure levels, the HNNSI is the Hulbert Financial Digest’s most sensitive barometer of investor sentiment.” Is HNNSI useful? Using a small sample of 38 values of HNNSI over the period April 2010 through September 2015 (generated by searching MarketWatch.com for “HNNSI”) and contemporaneous daily closes of the S&P 500 Index, we find that:
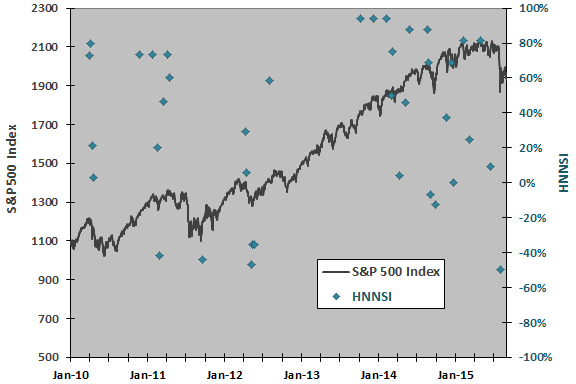
The following chart superimposes the HNNSI sample on a plot of the S&P 500 Index. The average value of HNNSI for the sample is 35.5%, with high 93.8% and low -50.0%. Visual inspection is not helpful for understanding the relationship between the HNNSI sample and S&P 500 Index returns. The published sample may be biased due to selection and clustering, because Mark Hulbert may be more likely to cite HNNSI, and cite it frequently, when it has extreme values.
For precision, we relate HNNSI to S&P 500 Index returns.
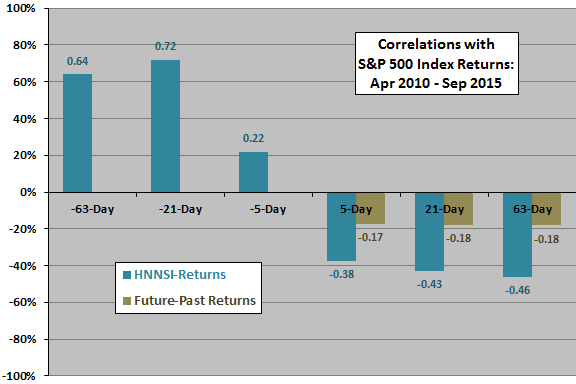
The following chart summarizes correlations between HNNSI and S&P 500 Index returns over past and future intervals of 5, 21 and 63 trading days. It also show correlations of future returns with past returns for intervals of equal duration (for example, the correlation between returns over the next 21 trading days with those over the past 21 trading days). Results suggest that:
- HNNSI newsletters are on average trend followers, increasing (decreasing) exposure in response to relatively strong (weak) past returns, especially returns over the past month.
- HNNSI newsletters on average overreact, such that high (low) sentiment levels indicate relatively strong (weak) returns over the next weak, month and quarter.
- HNNSI newsletter overreaction is due partly, but not entirely, to ignoring a tendency of the stock market to revert. In other words, HNNSI correlations with future stock market returns are larger in magnitude than future return-past return correlations.
Non-linearities in relationships and overlaps among return intervals (especially 63-day) may distort results.
For deeper understanding of correlations, we use scatter plots.
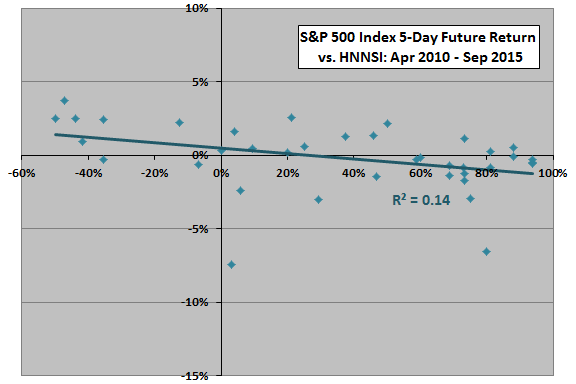
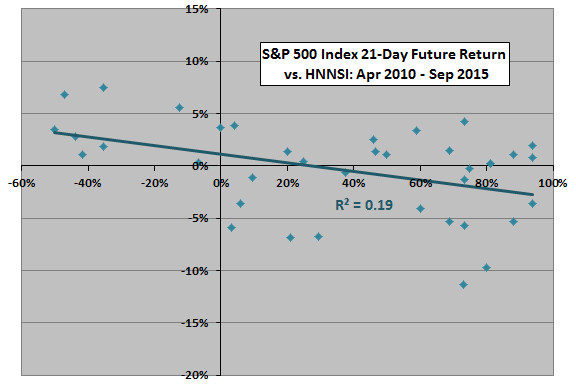
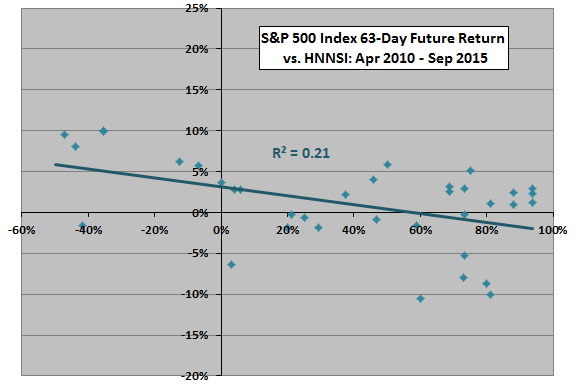
The following three scatter plots relate 5-day (upper chart), 21-day (middle chart) and 63-day (lower chart) S&P 500 Index future returns to HNNSI over the available sample. For all three horizons, slopes are negative, indicating that low sentiment is more bullish than high sentiment. R-squared statistics are 0.14, 0.19 and 0.21, respectively, indicating that level of HNNSI explains 14%-20% of the variation in stock market returns over the next week, month and quarter. However:
- As noted, the sample may have selection bias (overemphasis on extreme values) and clustering bias (overlapping returns). From a practical perspective, clustering confounds portfolio-level analysis due to a varying number of active positions (and implied cash reserves).
- There are many instances of positive returns even after high levels of HNNSI.
- There are few very negative HNNSI readings.
- The economic value of HNNSI is not obvious.
To investigate economic value, we look at cumulative returns after HNNSI observations.
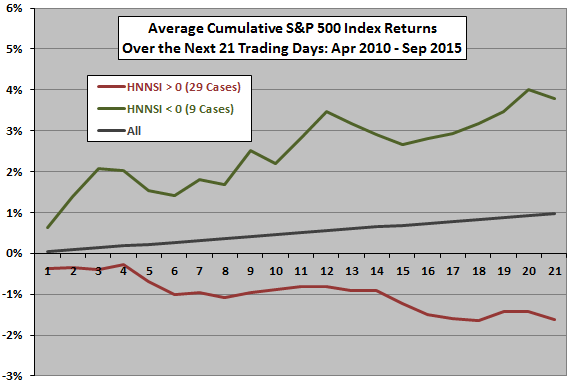
The final chart plots average cumulative returns for 21 trading days after 29 positive and 9 zero/negative HNNSI observations in the available sample. As a benchmark, it also shows average cumulative returns after all days since the beginning of 2010. Results show that the market performs worse than average by about 0.4% to 2.5% after positive observations of HNNSI and better than average by about 1.1% to 3.1% after zero/negative observations. However, selection and clustering biases may overstate expectations.
To address clustering (overlapping return) bias, we consider a simple trading rule that is long (short) the S&P 500 Index over the 5, 21 and 63 trading days after each zero/negative (positive) HNNSI observation. We skip observations if already invested, leaving a total of 35, 24 and 13 trades, respectively, over the sample period. Average gross (no trading frictions) returns over 5-day, 21-day and 63-day intervals are 0.68%, 1.74% and 0.33% respectively. For comparison, average returns over all 5-day, 21-day and 63-day intervals since the beginning of 2010 are 0.23%, 0.95% and 2.87%, respectively. Accounting for clustering materially reduces the trading value of HNNSI. It may be that acting on early signals within clusters does not work well. Also, exits based on HNNSI level may work better than fixed holding intervals.
In summary, evidence from simple tests on a small sample indicates that the Hulbert Nasdaq Stock Newsletter Sentiment Index has some inherent power to predict stock market returns over near horizons, but exploiting this predictability may be difficult.
Cautions regarding these findings include:
- The sample period offers limited variety in market conditions.
- As noted, the overall sample (38 observations) and especially subsamples are small, exacerbated by some clustering (such that future return measurements overlap).
- There are only 9 non-positive observations.
- There are only 13 non-overlapping 63-day future return observations.
- As noted, it is plausible that published HNNSI values are biased toward distribution tails. Statistics for a continuous sample may be different (weaker if like other sentiment variables).
- As noted, there may be more efficient ways to exploit HNNSI data using a continuous sample (but the cost of the data would affect net performance).