How does performance of short-term technical strategies related to portfolio turnover and volatility? In their December 2015 paper entitled “101 Formulaic Alphas”, Zura Kakushadze, Geoffrey Lauprete and Igor Tulchinsky explore return relationships among 101 real-life short-term quantitative trading strategies, noting that 80 are still in use as of the publication date. They follow common trader lingo in calling expected return “alpha.” The strategies, relying mostly on price and volume data, generally exploit mean reversion and/or momentum. Performance ignores trading frictions. Using gross trading data for the specified strategies during January 2010 through December 2013, they find that:
- Average (median) holding interval is 2.4 (2.1) days, ranging from a minimum 0.6 days to a maximum 6.4 days.
- Average (median) gross annualized Sharpe ratio is 2.26 (2.22), ranging from a minimum 1.24 to a maximum 4.16.
- Average (median) pairwise correlation of gross returns across strategies is a low 0.16 (0.14).
- Returns relate positively and strongly to return volatility. Returns vary with the 0.76th power of volatility (see the chart below).
- Neither returns nor correlations depend significantly on strategy turnover.
The following chart, taken from the paper, plots natural logarithm of average gross return versus natural logarithm of gross return volatility for the 101 strategies. The best fit line for the relationship indicates that return varies with the 0.76th power of volatility.
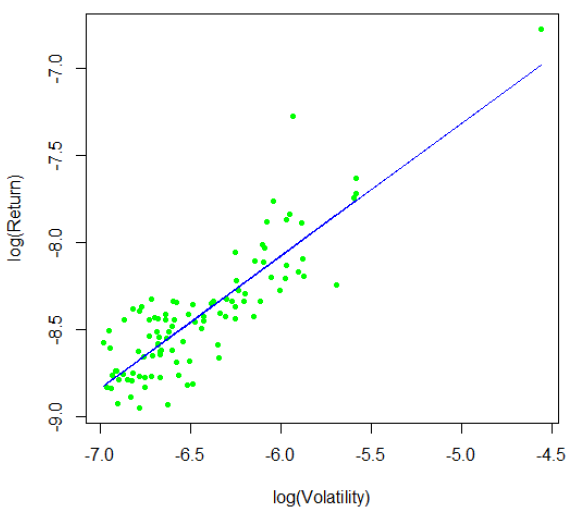
In summary, evidence indicates that average gross return for short-term technical trading strategies relates positively to return volatility.
Cautions regarding findings include:
- As noted in the paper, returns are gross. Accounting for trading frictions would reduce returns and could affect findings.
- Findings may be sensitive to the stock market volatility regime(s) during the sample period.
- The authors do not address how they select the 101 strategies in the sample. If the most successful strategies from a larger set (rather than a random sample), results overstate expected short-term quantitative strategy performance.
See “Profit Drivers of Actual Short-term Algorithmic Trading?” for the summary of a closely related paper.