Do simple ratios such as book-to-market value and earnings-to-market price really identify value stocks? In their January 2016 paper entitled “Facts About Fictional Value Investing”, U-Wen Kok, Jason Ribando and Richard Sloan examine the effectiveness of “value” investing as implemented via sorts on simple fundamental ratios. They investigate interactions of these ratios with firm capitalization and test whether it is the value numerator or the price denominator that drives mean reversion of extreme value ratios. Using data for a broad sample of U.S. stocks with focus on recent decades, they find that:
- There is little evidence that strategies based on simple value ratios work for U.S. equities. The driver for the gross long-short value premium since 1981 is underperformance of small capitalization stocks with low value ratios.
- These stocks comprise an average 3% of total U.S. stock market capitalization.
- Such stocks have substantial liquidity constraints/trading frictions.
- The average annual borrowing (shorting) fee for these stocks is 2.8%.
- Over the ten years ending July 2015, the “value” versions of major U.S. stock indexes (employing different simple value ratios and weighting schemes) have lower annualized returns, higher volatilities and lower Sharpe ratios than their broad market counterparts.
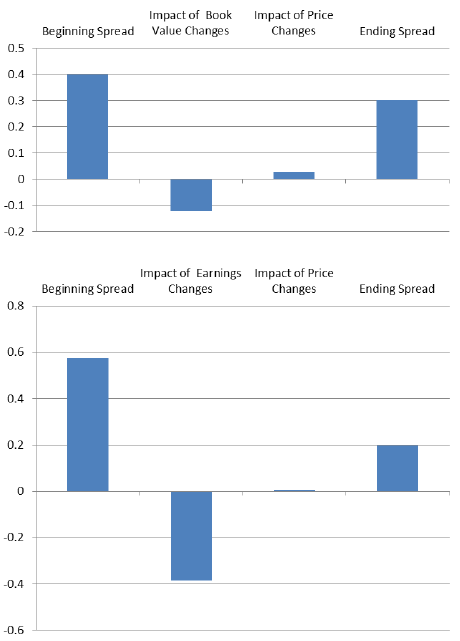
- Instead of identifying undervalued securities, simple value ratio strategies arguably identify firms with temporarily overstated book values and inflated past/forecasted earnings, not undervaluation. For the Russell 3000 Index during April 2002 through April 2015 (see the charts below):
- The spread in average book-to-market ratio between the top fifth (quintile) and the middle three quintiles of book values tends to narrow each year, almost entirely due to changes in book values.
- The spread in average earnings-to-price ratio (past actual or forecasted) between the top quintile and the middle three quintiles tends to narrow each year, almost entirely due to changes in earnings (past actual or forecasted).
The following charts, taken from the paper, summarize mean reversion drivers for “fake” value stocks from the Russell 3000 as identified by high book-to-market ratio (upper chart) and high lagged earnings-to-price ratio (lower chart) during April 2002 through April 2015. The first bar in each chart shows beginning-of-year average spread in the ratio between stocks in the highest quintile and stocks in the middle three quintiles. The second bar shows the subsequent annual change in the spread due to changes in the accounting variable in the numerator of the ratio. The third bar shows the subsequent annual change in the spread due to changes in stock price. The fourth bar shows the resulting average spread at the end of the year. Results indicate that changes in accounting variables (book value and earnings), not changes in stock prices, drive mean reversion of simple value ratios.
In summary, evidence indicates that U.S. stock investment strategies based on simple value ratios are not effective in recent decades.
Cautions regarding findings include:
- There may be some cycle in value versus growth performance that is unfavorable to value in recent years.
- The paper does not address whether stock selection strategies based on more rigorous (“non-fake”) definitions of value work well in recent years.