Do the 12 yearly signs of the Chinese Zodiac cycle (Rabbit, Dragon, Snake, Horse, Goat, Monkey, Rooster, Dog, Pig, Rat, Ox, Tiger) relate individually to stock market behavior? In their January 2016 paper entitled “The Zodiac Calendar and Equity Factor Returns”, Janice Phoeng and Laurens Swinkels calculate four annual equity factor returns for each of the Zodiac signs: (1) market minus the risk-free rate; (2) small capitalization minus big capitalization; (3) value minus growth; and, (4) high momentum versus low momentum. They start each year on the first day of the Zodiac New Year and end at the last day of the same Zodiac year. Using daily U.S. equity factor returns from Kenneth French’s data library during early February 1927 through mid-February 2015, they find that:
- Average factor returns vary considerably across Zodiac signs, with the Year of the Rooster (Ox) notably strong (weak) across factors. Specifically:
- Average market factor returns range from 12.9% for the Year of the Rabbit to -1.4% for the Year of the Snake.
- Average size factor returns range from 12.7% for the Year of the Goat to -5.2% for the Year of the Ox.
- Average value factor returns range from 10.8% for the Year of the Rooster to -4.3% for the Year of the Rabbit.
- Average momentum factor returns range from 17.8% for the Year of the Snake to -1.5% for the Year of the Ox.
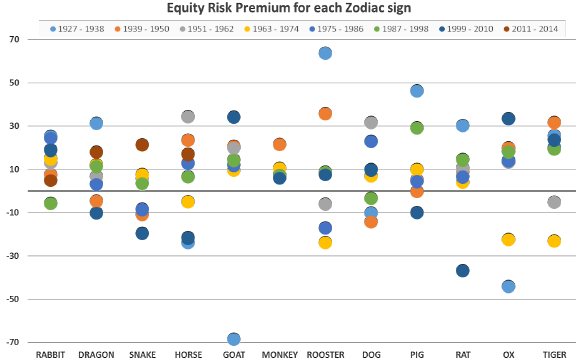
- However, subsamples by sign are so small and the variabilities of annual factor returns by sign so large (see, for example, the chart below) that differences in averages across signs do not achieve a conventional 90% confidence level.
The following chart, taken from the paper, summarizes market risk factor returns by Zodiac sign by year (seven measurements for each sign) over the entire sample period. Variabilities in returns for the small Zodiac sign subsamples are generally too large to support confident estimation and comparison of averages.
In summary, evidence offers little support for belief that U.S. equity market behaviors relate reliably to the Chinese Zodiac.
Cautions regarding findings include:
- There is no obvious reason to believe that Chinese cultural beliefs should influence U.S. stock market behavior.
- As noted in the paper, the sample is very small in terms of number of Chinese Zodiac cycles (only about 7.3), rendering effects of outliers large in subsamples by sign.