What happens out-of-sample to stock portfolios with weights derived from extreme in-sample fitting? In their February 2016 paper entitled “Stock Portfolio Design and Backtest Overfitting”, David Bailey, Jonathan Borwein and Marcos Lopez de Prado examine backtest overfitting in the context of designing a stock portfolio/fund. Their test approach is:
- Construct split-adjusted, dividend-reinvested price series for all S&P 500 components as of January 22, 2016 with continuous monthly prices during 1991 through 2015 (277 stocks).
- Select a target performance profile, including annualized return (6%, 8%, 10%, 12% 15% or 18%) and “shape” of return (principally, steady increase every month).
- Apply an optimization program to determine the fixed stock price weights (0.1% increments) that achieve target performance profile in-sample during 1991-2005 (requiring monthly rebalancing of the portfolio to those weights).
- Apply these stock price weights during 2006-2015 (again, with monthly portfolio rebalancing) to measure out-of-sample performance.
In initial tests, they allow negative weights (shorting). Because of the risks of shorting, they repeat analyses with a long-only constraint. They note that their in-sample fitting process considers “an inconceivably large set” of possible weights. They use the S&P 500 Total Return Index as a benchmark. Using adjusted monthly prices for the specified stocks from the end of December 1990 through the beginning of January 2016, they find that:
- On a gross basis, every long-short portfolio fits its target performance profile almost perfectly in-sample. In other words, finding a long-short stock portfolio that achieves any desired performance profile in a backtest is relatively straightforward.
- However, these long-short portfolios perform erratically out-of-sample. Among the six target profiles for steady growth:
- Two exhibit remarkably strong gross performance.
- Four are ruinous (two crash immediately).
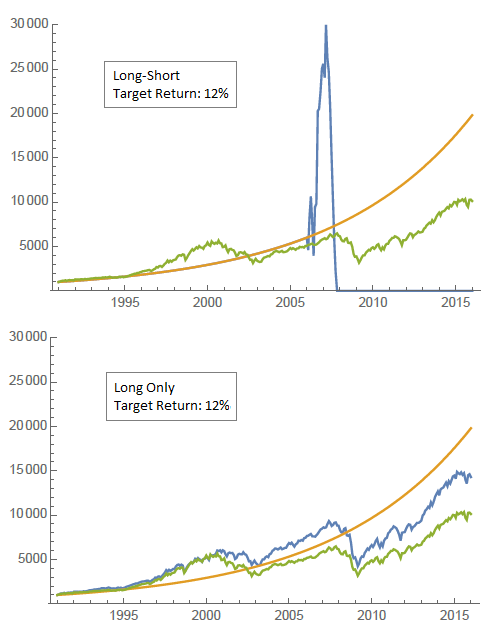
- None come close to tracking the target performance profile (see the example below for a 12% annualized return target).
- Long-only portfolios are much less erratic but fail to track target performance profiles either in-sample or out-of-sample. Among the six profiles for steady growth, all achieve higher terminal values than the S&P 500 Total Return Index on a gross basis, but with higher volatility (36% higher on average).
The following charts, taken from the paper, track gross cumulative performances of the following portfolios:
- S&P 500 Total Return Index (green, in both charts).
- Target performance of 12% annualized return with steady monthly growth (orange, in both charts).
- Long-short stock portfolio designed to track the target performance profile in-sample (blue, in the upper chart).
- Long-only stock portfolio designed to track the target performance profile in-sample (blue, in the lower chart).
The in-sample period is 1991 through 2005. The out-of-sample period is 2006 through 2015. There is no blue line in the upper chart during the in-sample period because the orange line obscures it. Results indicate that:
- There is a long-short portfolio that perfectly tracks the target performance profile in-sample.
- The long-short portfolio exhibits erratic performance out-of-sample, going bust after two years.
- The long-only portfolio generally fails to track the target performance profile in-sample and out-of-sample.
- The long-only portfolio generally outperforms the benchmark index, but with higher volatility.
In summary, evidence from intensive backtesting of a moderately large universe of stocks suggests that researchers can model very specific (and aggressive) performance targets in-sample, but out-of-sample results will exhibit extremely poor tracking and are often ruinous.
One implication of findings is that smart beta funds constructed based on considerable backtesting are likely to disappoint out-of-sample.
Cautions regarding findings include:
- By screening for stocks with long histories, the above stock sampling methodology incorporates survivorship bias that tends to boost portfolio returns.
- The portfolio construction approach used above assigns weights to stock price series and aggregates across all series (holding a fixed number of split-adjusted shares of each stock over time). This approach is different from one that assigns weights as fractions of portfolio dollar value (and requires periodic rebalancing to maintain fixed weights). The authors state that findings would be similar for the latter approach.
- Smart beta portfolios may have dynamic weights tied to some stock/firm characteristic, selected to exploit some fundamental/behavioral hypothesis. The above tests are strictly mathematical.