Trading Calendar presents full-year and monthly cumulative performance profiles for the overall stock market (S&P 500 Index) based on its average daily behavior. How much do the corresponding monthly behaviors of the various size and value/growth styles deviate from an overall equity market profile? To investigate, we consider the the following six exchange-traded funds (ETF) that cut across capitalization (large, medium and small) and value versus growth:
iShares Russell 1000 Value Index (IWD) – large capitalization value stocks.
iShares Russell 1000 Growth Index (IWF) – large capitalization growth stocks.
iShares Russell Midcap Value Index (IWS) – mid-capitalization value stocks.
iShares Russell Midcap Growth Index (IWP) – mid-capitalization growth stocks.
iShares Russell 2000 Value Index (IWN) – small capitalization value stocks.
iShares Russell 2000 Growth Index (IWO) – small capitalization growth stocks.
Using monthly dividend-adjusted closing prices for the style ETFs and SPDR S&P 500 (SPY) during August 2001 through October 2021 (limited by data for IWS/IWP), we find that:
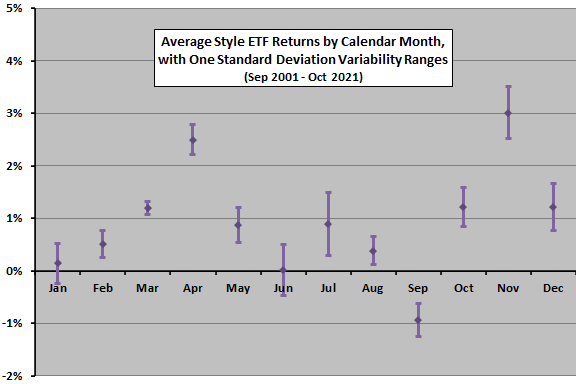
The following chart shows average (equally weighted aggregate) style performance and dispersion of style performances by calendar month over the sample period. Overall, spring and fall are stronger than late winter and summer months over the available sample period.
Style returns are generally similar by month, with the largest dispersions in June, July, November and December. Small dispersions suggest little opportunity to identify clear calendar-based style preferences.
For greater detail, we look at a breakdown by style.
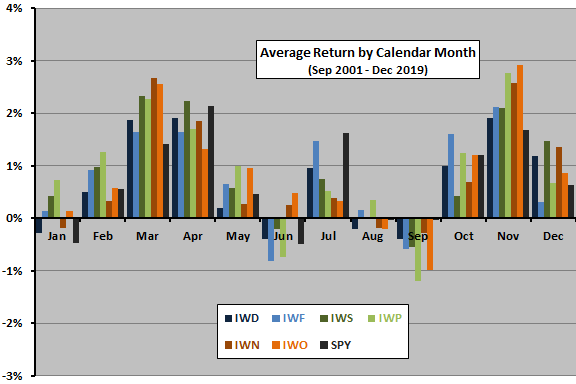
The next chart summarizes average return by calendar month for the six style ETFs and SPY over the available sample period. There are some differences in seasonality among these ETFs. For example:
- Value beats growth in March, April and December.
- Growth beats value in October and November.
- Large capitalization underperforms in several months, but outperforms in July and October.
However, the sample period is too short (20 years) and performance differences among style ETFs by calendar month generally too small for confident inference.
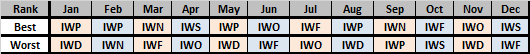
For another perspective, the following table lists the best and worst style ETFs by calendar month.
In summary, evidence from available data suggests the possibility of some systematic differences in seasonality among size and value/growth ETFs, but the combination of small sample size and modest magnitude of differences limits confidence.
Cautions regarding findings include:
- As noted, the sample period is very short for reliable inference about annual cycles.
- The iShares style definitions may not be concentrated enough to exploit style peculiarities identified in some research.
See also “Sector Performance by Calendar Month”.