As a follow-up to “Sunspot Cycle and Stock Market Returns” a reader asked: “Sunspot activity does have a direct relationship to weather. Could one speculate on the agriculture market using the sunspot cycle?” To investigate, we relate sunspot activity to the fairly long U.S. Producer Price Index (PPI) for grains. Using monthly averages of daily sunspot counts and monthly PPI for grains during January 1926 (limited by PPI data) through October 2018, we find that:
The National Weather Service notes:
“There is debate within the scientific community how much solar activity can, or does affect Earth’s climate. There is research which shows evidence that Earth’s climate is sensitive to very weak changes in the Sun’s energy output over time frames of 10s and 100s of years. Times of maximum sunspot activity are associated with a very slight increase in the energy output from the sun. Ultraviolet radiation increases dramatically during high sunspot activity, which can have a large effect on the Earth’s atmosphere. The converse is true during minimum sunspot activity. But trying to filter the influence of the Sun’s energy output and its effect on our climate with the ‘noise’ created by a complex interaction between our atmosphere, land and oceans can be difficult.”
If there is a sunspot activity-weather relationship, we hypothesize that a high sunspot count (warm weather) would depress grain prices (support good crops).
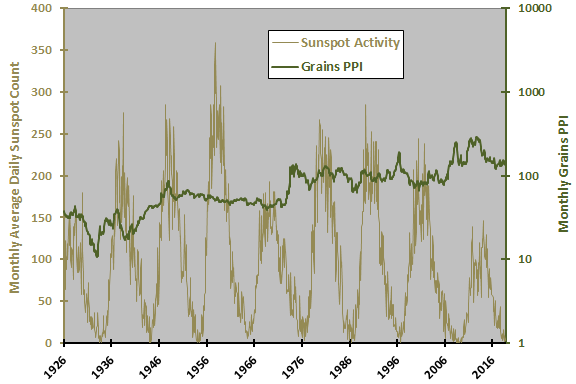
The following chart plots monthly sunspot activity and grains PPI, with the latter on a logarithmic scale. There are about nine 11-year sunspot cycles in the full sample, with the peak at the end of the 1950s strongest and the most recent peak the weakest. Visual inspection reveals no obvious relationship between the two series.
The sunspot series appears to have a reasonably stable average (95.0 for this sample), while the grains PPI series does not. We therefore proceed by relating monthly sunspot activity to monthly change in grains PPI. Because investors know that the sunspot cycle is predictable, we can use coincident data.
The following scatter plot relates monthly change in grains PPI to monthly sunspot activity over the full sample period. The Pearson correlation for the two series is -0.03 and the R-squared statistic is 0.00, indicating that variation in monthly sunspot activity explains none of monthly variation in grains PPI.
In case sunspot effects are longer-term, we look at annual data.

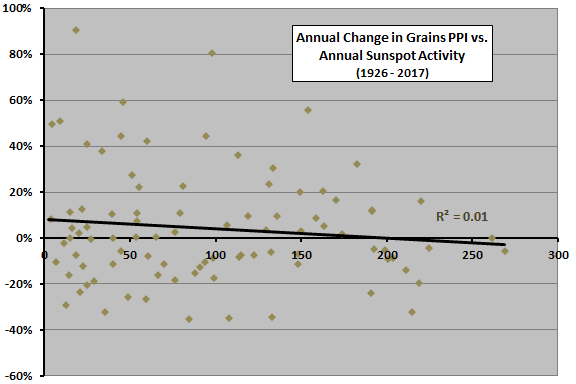
The next scatter plot relates annual change in grains PPI to annual sunspot activity (average of monthly activity during the year) over the full sample period. The Pearson correlation for these two series is -0.07 and the R-squared statistic is 0.01, indicating that annual sunspot activity may have a slightly negative relationship to annual change in grains PPI (very weakly supporting the hypothesis).
In case the relationship is materially non-linear, we look at average annual change in grains PPI by ranked third (tercile) of annual sunspot activity.
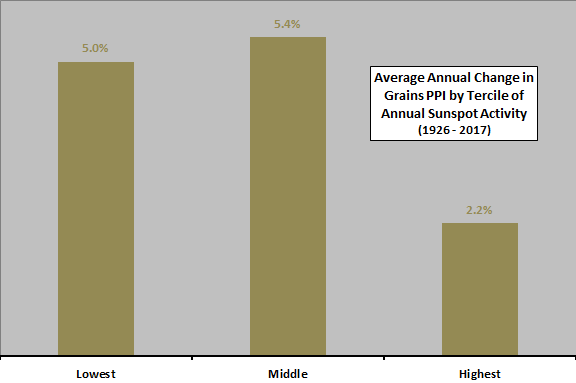
The next chart summarizes average annual changes in grains PPI by tercile of annual sunspot activity over the full sample period. There are 30 observations per tercile. Results suggest that low and moderate sunspot activity is better for grain prices than high sunspot activity, supporting the hypothesis that grains are less plentiful for those conditions. However, tercile subsamples are small, and the relationship is not systematic across terciles, so findings are not very reliable.
Might sunspot activity and change in grains PPI interact with a lag?
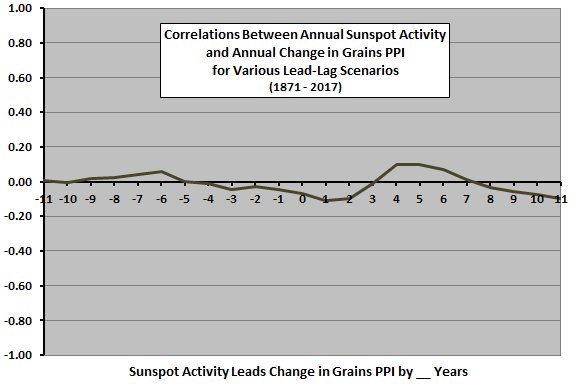
The final chart summarizes correlations for various lead-lag relationships between annual sunspot activity and annual change in grains PPI over the full sample period, ranging from change in grains PPI leads sunspot activity by 11 years (-11) to sunspot activity leads change in grains PPI by 11 years (11). Notable points are:
- Grains may interact very weakly with sunspot activity on a long cycle, with peaks in correlations about 11 years apart.
- The coincident relationship, as found above, is slightly negative. This negative correlation persists for sunspot activity leading change in grains PPI by one and two years.
- The left peak suggests that change in grains PPI leads sunspot activity with positive correlations by six to seven years. However, this peak is very weak.
- The right peak suggests that sunspot activity leads change in grains PPI by four to six years.
There may be some underlying agricultural explanation for correlation dips and peaks, but not an obvious one. Given the very small number of solar cycles and bull-bear grain cycles in the sample, the peaks may be just noise.
In summary, evidence from simple tests on available data offers very little support for use of sunspot activity as a grains commodity timing tool, with slight indication that high sunspot activity puts downward pressure on price.
Cautions regarding findings include:
- As noted, there are only about nine sunspot cycles during the sample period, so overall findings are not very reliable. Also as noted, the number of observations in the tercile subsamples is small, such that a few outliers materially affect the average tercile changes in grains PPI.
- All analyses are in-sample. An investor operating in real time based only on past data may have drawn different conclusions at different times.