A reader inquired about the validity of Martin Zweig’s Four Percent Model, which states (from pages 93-94 of the 1994 version of Martin Zweig’s Winning on Wall Street):
“The Four Percent Model for the stock market works as follows. First, It uses the Value Line Composite Index…an unweighted price index of approximately seventeen hundred stocks… All you need to construct this model is the weekly close of the Value Line Composite. You can ignore the daily numbers if you wish… This trend-following model gives a buy signal when the weekly Value Line Index rallies 4% or more from any weekly close. It then gives a sell signal when the weekly close of the Value Line Composite drops by 4% or more from any weekly peak. …That’s all there is to it. …The model is designed to force you to stay with the market trend.”
We execute this description as follows (after identifying the first signal):
- After a buy signal, generate the next sell signal upon a 4% or greater decline from a subsequent high water mark (including the buy signal level).
- After a sell signal, generate the next buy signal upon a 4% or greater advance from a subsequent low water mark (including the sell signal level).
We test the usefulness of the signals on the following exchange-traded funds (ETF) over their entire available histories: SPDR S&P 500 (SPY), PowerShares QQQ (QQQ), iShares Russell 2000 Index (IWM) and Guggenheim S&P 500 Equal Weight (RSP). Using weekly closes of the Value Line Geometric Index and the dividend-adjusted weekly opens of the selected ETFs from their respective inceptions through September 2014, we find that:
In testing this indicator, we make the following assumptions for all trading vehicles:
- Execute weekly close signals at the open the next week.
- Cash earns the contemporaneous 13-week Treasury bill (T-bill) yield while out of stocks (a long only strategy).
- Consider both frictionless trading and various constant levels of trading friction for entering or exiting ETFs.
- Ignore tax consequences of trading.
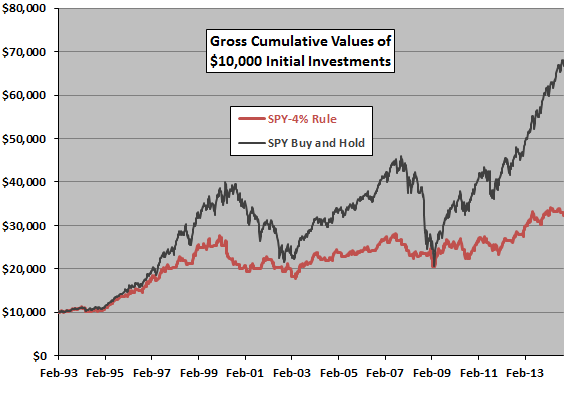
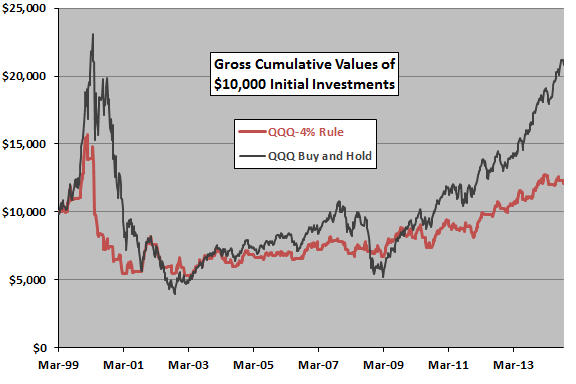
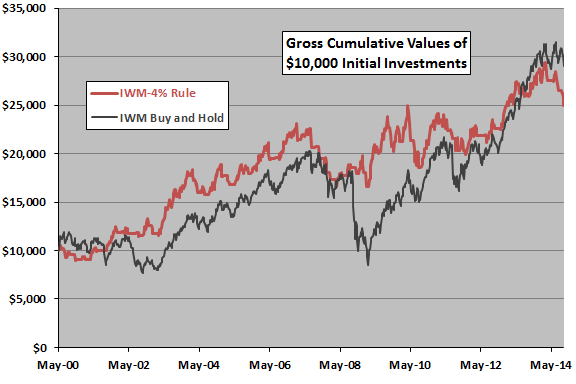
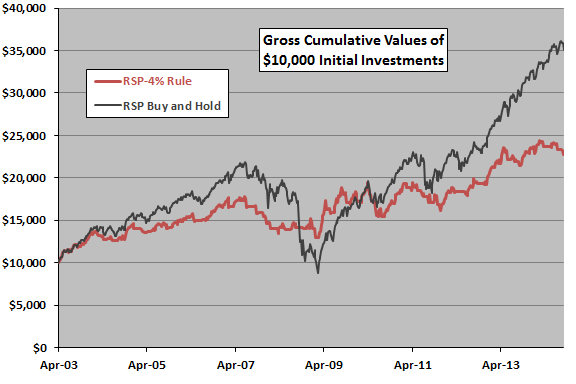
The following four charts track the gross performance of the 4% rule as applied to SPY, QQQ, IWM and RSP, respectively, over their available histories. The charts also show the performance of a respective buy-and-hold approach as a benchmark. Results suggest that the 4% rule applied to broad stock ETFs:
- Suppresses volatility and drawdowns but generally underperforms based on cumulative value.
- Works better in a sample with a higher proportion of equity bear market conditions, as for QQQ and IWM (see “The 2000s: A Market Timer’s Decade?”).
- Would work better when the sample period starts near a stock market peak.
For different perspectives, we consider and array of performance statistics.
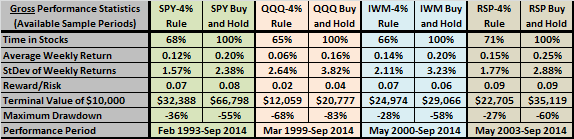
The following table summarizes gross performance statistics for the 4% rule as applied to the four ETFs, with statistics for corresponding buy-and-hold approaches as benchmarks. Results indicate that the 4% rule:
- Is in the ETFs about one third of the time, depending somewhat on the sample period.
- Generally underperforms buy-and-hold based on average gross weekly return.
- Generally suppresses weekly return volatility as measured by standard deviation (StDev) of weekly returns.
- Is generally competitive with buy-and-hold based on gross reward/risk (gross average weekly return divided by standard deviation of weekly returns).
- Generally loses to buy-and-hold based on terminal wealth.
- Generally reduces maximum drawdown substantially.
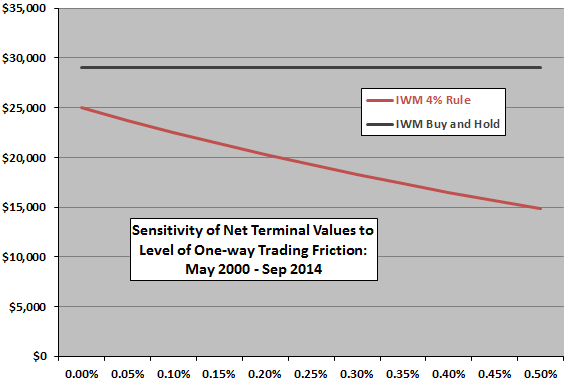
How strongly do trading frictions affect performance of the 4% rule?
The final chart shows how the terminal value of the 4% rule applied to IWM (best case for the 4% rule among the four above) varies across levels of one-way trading frictions ranging from 0.00% (gross) to 0.50%. There are 50 buys and 50 sells over the sample period, such that the cumulative effect of trading frictions is material even for low frictions.
In summary, evidence from simple tests does not offer much support for belief that Martin Zweig’s Four Percent Model is a useful tool for stock market timing on a net basis.
A more positive view of the indicator may derive from snooping of the signal threshold within the discovery dataset, from ignoring trading frictions and/or from ignoring dividends.
Cautions regarding findings include:
- The source data for the Value Line Composite Geometric Index is not well documented. The Value Line Composite Arithmetic Index may generate different results.
- Some signal threshold other than 4% may work better, but empirical testing of different values would introduce data snooping bias into results.
- Given the volatility suppression, investors might consider using the 4% rule with leverage while in stocks to boost average return and terminal value (but leverage is not free).
- The extremely low return on cash during recent years adversely affects market timing rule performance.