Does the lunar cycle still (since our last look seven years ago) affect the behavior of investors/traders, and thereby influence stock returns? In the August 2001 version of their paper entitled “Lunar Cycle Effects in Stock Returns” Ilia Dichev and Troy Janes conclude that: “returns in the 15 days around new moon dates are about double the returns in the 15 days around full moon dates. This pattern of returns is pervasive; we find it for all major U.S. stock indexes over the last 100 years and for nearly all major stock indexes of 24 other countries over the last 30 years.” To refine this conclusion and test recent data, we examine U.S. stock returns around new and full moons since 1990. When the date of a new or full moon falls on a non-trading day, we assign it to the nearest trading day. Using dates for new and full moons for January 1990 through August 2018 as listed by the U.S. Naval Observatory (355 full and 354 new moons) and contemporaneous daily closing prices for the S&P 500 Index, we find that:
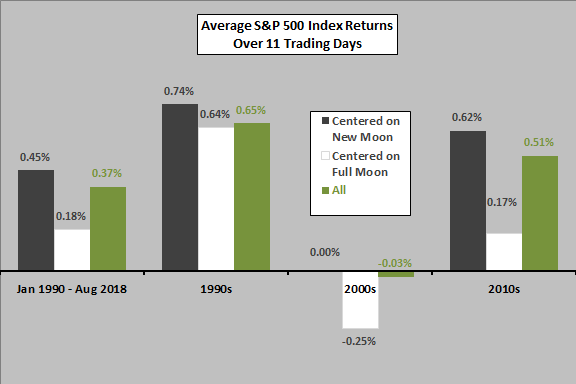
The following chart summarizes average S&P 500 Index returns for the 11 trading days (about half a month) for all days and for days centered on new moons or on full moons over the full sample period and by decade (through August 2018 for 2010s).
Results are in rough agreement with the conclusion of the study cited above, with intervals centered on new moons consistently outperforming those centered on full moons.
The standard deviation of 11-day returns over the full sample period is 2.94% (3.41%) centered on new (full) moons, large compared to the difference in average returns.
How is the difference in returns around new and full moons distributed?
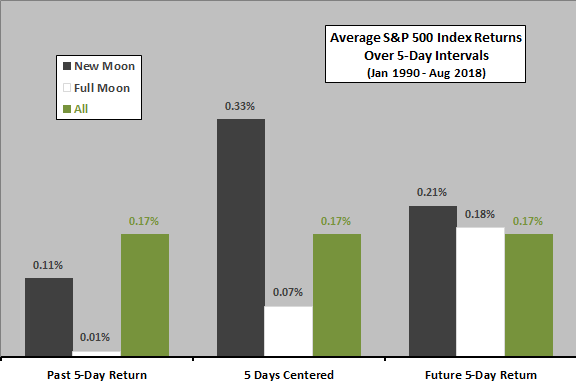
The next chart compares average S&P 500 Index returns over the entire sample period for three intervals relative to new or full moons: (1) the five trading days just before full or new moons; (2) the five trading days centered on new or full moons; and, (3) the five trading days just after new or full moons. Average return for all 5-day intervals is 0.17%.
Notable point are:
- Average outperformance of the interval around new moons comes mostly from returns before and immediately around new moons.
- However, average return just before new moons is below normal.
- Average return just after full moons is normal.
Standard deviations of 5-day returns for these intervals over the full sample period are in the range 2.01%-2.55%, large compared to differences in average returns.
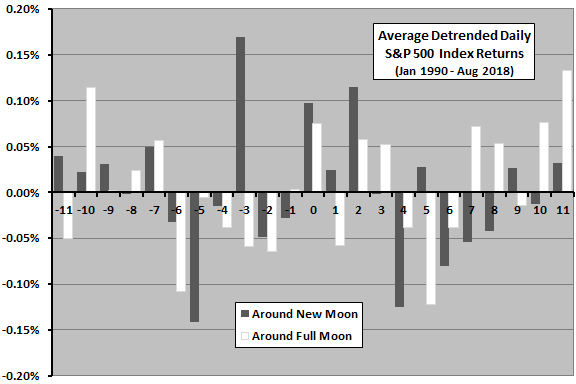
For deeper insight, we look at daily average returns around new and full moons.
The final chart summarizes average daily detrended S&P 500 Index returns from 11 trading days before to 11 trading days after new moons and full moons We detrend by subtracting the average daily return for the full sample period (0.04%) from the raw average returns for each trading day in the intervals tested. Lack of systematic variation in daily detrended returns undermines belief in the lunar cycle as the explanation of new-full moon difference in average returns.
Physicist Charles Pennington employs a different approach using a Fourier transform, concluding that lunar cycle effects on SPDR S&P 500 (SPY) are, if they exist, very small.
In summary, evidence from simple tests confirms that the U.S. stock market since 1990 performs better on average around new moons than full moons, but the effect is “lumpy.”
Cautions regarding findings (as noted above) include:
- As noted, levels of outperformance are small compared to return variability, so trading them is very risky.
- Levels of outperformance are not convincingly consistent across subperiods and daily returns.