A reader asked whether Charles Nenner, self-described as “the talk of Wall Street since accurately predicting some of the biggest moves in the Markets over the past few years,” accurately forecasts equity and commodity markets. We consider the following:
- In his July 2007 discussion of the “Nenner Methodology at the Bloomberg Studio”, Charles Nenner cites sunspot activity as a specific key indicator for equity returns. Per this source, he believes that the sunspot cycle correlates strongly with equity markets via the predictable effects of magnetic field disturbances on investors.
- In “Sunspots Predict ‘Major Crisis’ After 2013: Chartist”, he states: “If there is a high intensity of sunspots, markets rise, if their intensity lowers, markets go down because sunspots affect people’s mood.”
Is there a reliable relationship between sunspot activity and stock market returns? Using monthly averages of daily sunspot counts and monthly levels of Shiller’s S&P Composite Index (also monthly averages of daily levels) during January 1871 (limited by the Shiller data) through October 2018, we find that:
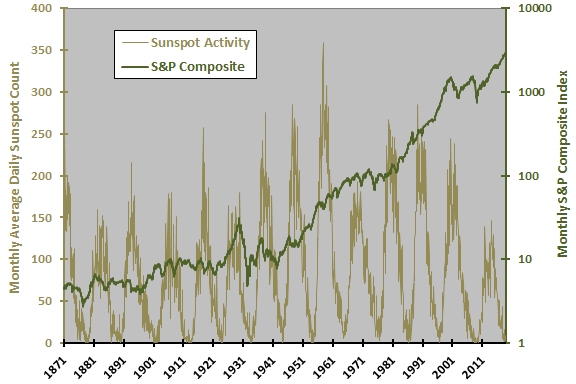
The following chart plots monthly sunspot activity and the S&P Composite Index, with the latter on a logarithmic scale. There are about 14 11-year sunspot cycles in the full sample, with the peak at the end of the 1950s strongest and the most recent peak the weakest. Visual inspection reveals no obvious relationship between the two series.
The sunspot series appears to have a reasonably stable average (83.2 for this sample), while the stock market series does not. We therefore proceed by relating monthly sunspot activity to S&P Composite Index monthly return. Because investors know that the sunspot cycle is predictable, we can use coincident data.
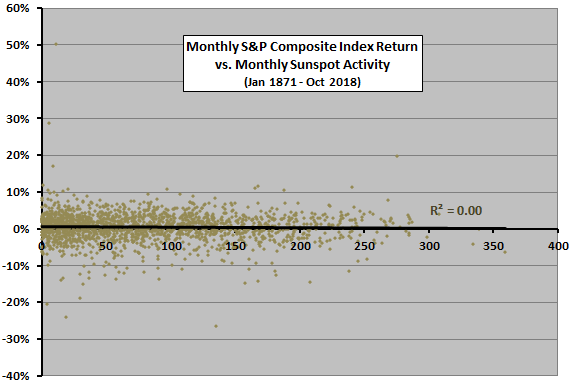
The following scatter plot relates monthly S&P Composite Index return to monthly sunspot activity over the full sample period. The Pearson correlation for the two series is -0.02 and the R-squared statistic is 0.00, indicating that variation in monthly sunspot activity explains none of monthly variation in stock market return.
In case sunspot effects are longer-term, we look at annual data.
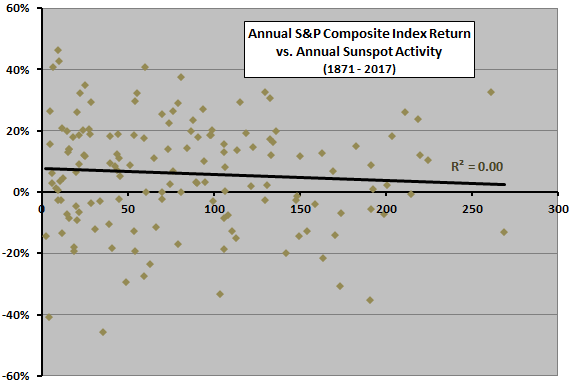
The next scatter plot relates S&P Composite Index annual return to annual sunspot activity (average of monthly activity during the year) over the full sample period. The Pearson correlation for these two series is -0.07 and the R-squared statistic is 0.01, indicating that annual sunspot activity may have a slightly negative relationship to annual stock market return (opposite Charles Nenner’s belief).
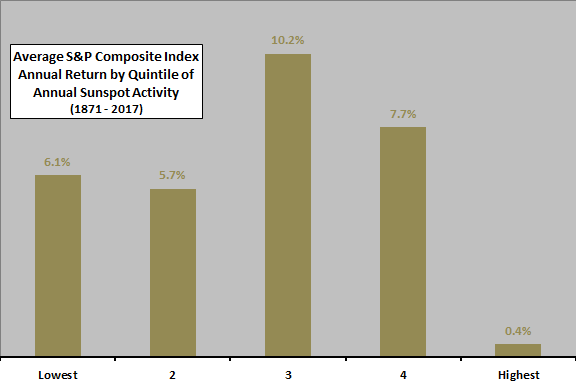
In case the relationship is materially non-linear, we look at average annual S&P Composite Index return by ranked fifth (quintile) of annual sunspot activity.
The next chart summarizes average annual S&P Composite Index returns by quintile of annual sunspot activity over the full sample period. There are 29 observations per quintile. Results suggest that low and moderate sunspot activity is better for the stock market than high sunspot activity. Results for the highest quintile starkly contradict Charles Nenner’s belief. However, quintile subsamples are small, and the relationship is not systematic across quintiles, so findings are not very reliable.
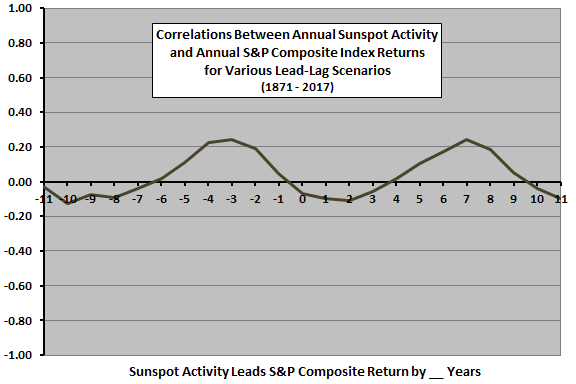
Might sunspot activity and stock market return interact with a lag?
The final chart summarizes correlations for various lead-lag relationships between annual sunspot activity and S&P Composite Index annual return over the full sample period, ranging from stock market return leads sunspot activity by 11 years (-11) to sunspot activity leads stock market return by 11 years (11). Notable points are:
- The stock market may interact with sunspot activity on a long cycle, with peaks in correlations about 11 years apart.
- The coincident relationship, as found above, is slightly negative. The negative correlations persist for sunspot activity leading stock market return by one and two years.
- The left peak suggests that stock market return leads sunspot activity with positive correlations by two to five years. In other words, relatively strong returns precede sunspot peaks.
- The right peak suggests that sunspot activity leads stock market return by five to eight years, an implausible scenario for investor mood effects.
There may be some underlying physical-economic explanation for correlation dips and peaks, but not an obvious one. An investor mood explanation seems unlikely. Given the small number of solar cycles and bull-bear stock cycles in the sample, the peaks may be just noise. In any case, Charles Nenner’s prediction that the bull market commencing in 2009 would end in 2013-2014 with the sunspot cycle peak was incorrect.
In summary, evidence from simple tests on available data offers little support for use of sunspot activity as a stock market timing tool, and conflicts with Charles Nenner’s belief.
Cautions regarding findings include:
- As noted, there are only about 14 sunspot cycles during the sample period, so overall findings are not very reliable. Also as noted, the number of observations in the quintile subsamples is small, such that a few annual return outliers materially affect the average quintile returns.
- All analyses are in-sample. An investor operating in real time based only on past data may have drawn different conclusions at different times.