Does the Labor Day holiday, marking the end of summer vacations, signal any unusual return effects by refocusing U.S. stock investors on managing their portfolios? By its definition, this holiday brings with it any effects from the turn of the month. To investigate the possibility of short-term effects on stock market returns around Labor Day, we analyze the historical behavior of the stock market during the three trading days before and the three trading days after the holiday. Using daily closing levels of the S&P 500 Index for 1950 through 2022 (73 observations), we find that:
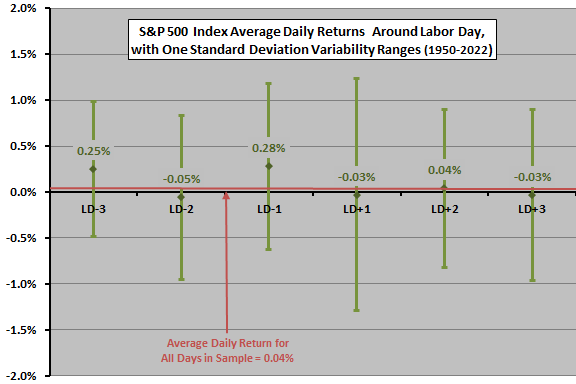
The following chart shows S&P 500 Index average daily returns over the three trading days before (LD-3 to LD-1) and the three trading days after (LD+1 to LD+3) Labor Day for the full sample period, with one standard deviation variability ranges. The average daily return for all trading days in the sample is 0.04%. Results suggest some strength on the Friday before Labor Day and no notable abnormal returns after the holiday. Variability is relatively high the day after Labor Day.
As usual for daily data, noise generally dominates signal (standard deviations are large compared to any indicated abnormalities in average daily returns).
To check the stability of the pre-holiday peak, we next look at a “modern” subsample.
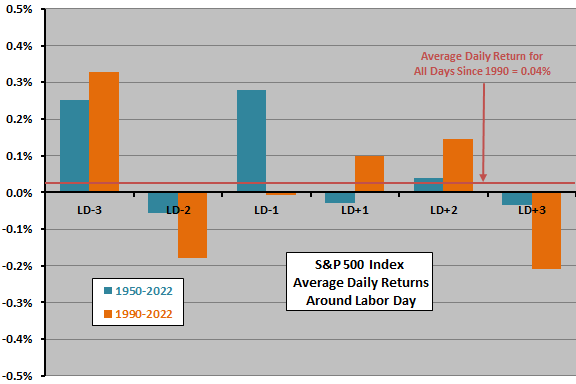
The next chart compares S&P 500 Index average daily returns over the three trading days before and after Labor Day in the entire sample to those for a 1990-2022 subsample (33 observations). This chart shows no variability ranges and uses a finer vertical scale than the preceding chart. There are noticeable differences, with the peak the day before Labor Day missing for recent data. These differences undermine belief in an exploitable anomaly.
Variability is notably high the day after Labor Day for both the entire sample and the subsample.
Some of the differences between the overall sample and the subsample are noise. Could the shift in peaks relate to the turn-of-the-month effect (whether Labor day comes early or late within its one-week window)?
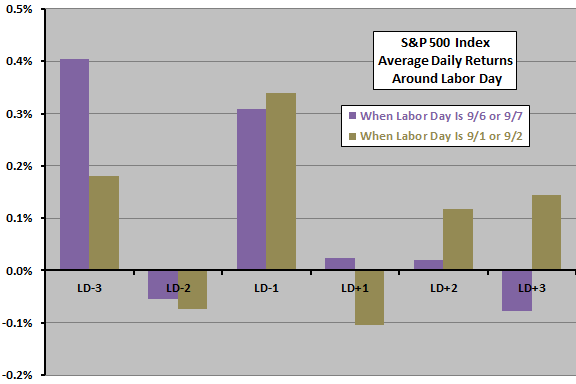
The final chart compares S&P 500 Index average daily returns over the three trading days before and after Labor Day for the 21 observations when Labor Day occurs earliest (9/1/ or 9/2) and the 21 observations when Labor Day occurs latest (9/6 or 9/7) over the entire sample period. The patterns are somewhat similar. It appears that the turn-of-the-month effect does not greatly influence the main result, though a late Labor Day is stronger overall than an early one.
In summary, best guess is that any anomalous U.S. stock market behavior around Labor Day is a relatively strong return one trading day before the holiday and high volatility the day after, but noise generally dominates and recent data does not support belief in a return anomaly.
Cautions regarding the finding include:
- As noted, any return anomaly is small compared to return variability, so experience by year varies widely.
- To the extent that the distribution of daily S&P 500 Index returns is wild, interpretation of the average return and standard deviation of returns breaks down.